

.jpg?width=300&name=Untitled%20(11).jpg)
Is Die Hard a holiday movie? Over the years many people have weighed in on the debate. Ultimately, the arguments seem to be confined by the various definitions of what a “holiday movie” actually is. Is it a family movie? Does the movie plot take place during the holidays? Was it first released during the holiday season? As a team that encourages clean and defined data, we couldn’t appreciate the need for definition more. With the definition undetermined, it makes sense why the argument remains strong (and steadfast) from both sides.
Still, we wonder, could there be data out there that helps us answer this annual debate? We decided to take an analytical approach by utilizing data that represents search behaviors during the holiday season. Does this unique data source shed light on the question of whether or not Die Hard is indeed a seasonal flick? Let’s use historical data to find out what time of year the movie is most popularly searched and use Dataiku’s Time Series Forecasting capabilities to forecast its popularity this holiday season.
Choosing a Die Hard Data Set
Online movie services don’t generally share how many times a movie has been streamed or downloaded per week over several years, so we are using Google Trends as our best available dataset. We will assume that search interest is highly correlated to how much a movie is watched in that time period. The dataset is a weekly count for the last 5 years, restricted to United States data only. It simply includes a weekly start date (always a Sunday) along with a corresponding “interest” (popularity) score. The interest score is always normalized to make 100 the highest value in the time period shown, meaning the higher number indicates more interest.
Preparing Your Data for Time Series Forecasting
We’ve curated our dataset to only include one product/item (Die Hard) which we’ll be using to forecast future demand (popularity rating), so there is very little prep work that needs to be done. If you are working to forecast multiple products in many stores or regions, Dataiku’s blog provides more detail on data preparation.
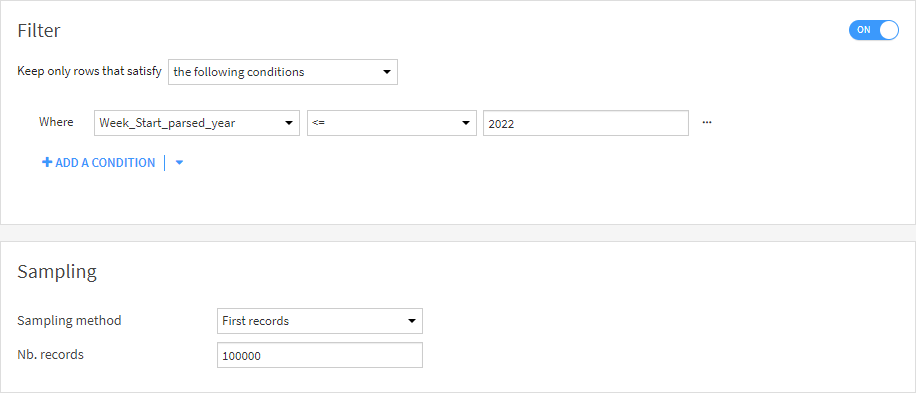
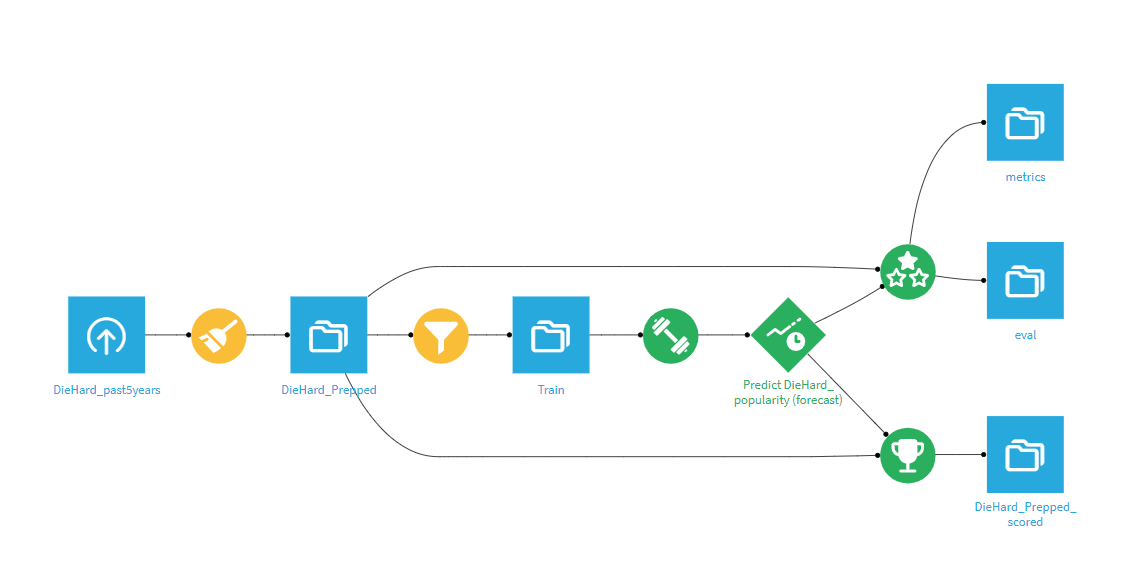
The Die Hard dataset included a Week_Start field along with its search popularity (Die Hard: (United States)). The Week_Start dates need to be parsed for the Time Series Forecasting to recognize dates properly. After parsing dates, we used the Extract date function to get the year corresponding to the Week_Start.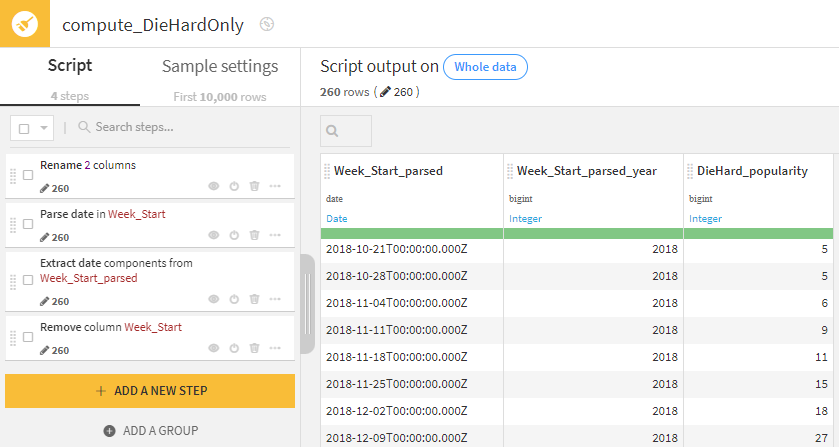 Once prep is done, we can complete a Filter recipe on the newly extracted Year value. This is done to break apart the data between October 2018 and December 2022 as known values for training/testing, and the 2023 known values can then be used to evaluate the time series model.
Using Dataiku Visual Time Series Analysis
We can now select the Train dataset that was an output from the Filter recipe and select Time Series Forecasting from within Lab. This brings up a window where we can enter the numeric feature (what we want to forecast) through time. For this example, we select DieHard_popularity through WeekStart_parsed. If you have multiple items to evaluate, all it takes is prepping the data accordingly to have another column used as the identifier column. Dataiku allows for the whole gamut of quick and easy modeling, all the way to Deep Learning Models. For the sake of this example, we will select Quick Prototypes.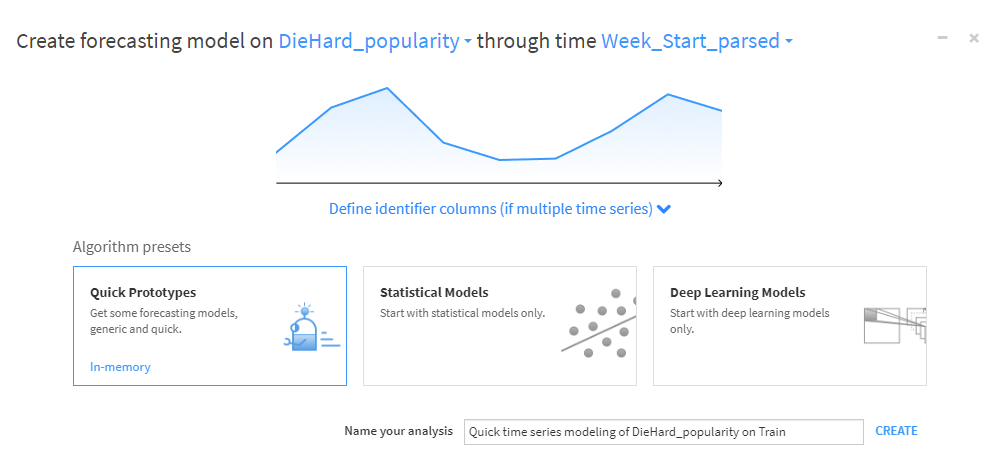 The "Design" window allows you to select many parameters such as the Time Step (weekly was correctly auto-detected in our case), day of the week for the dataset, setting details for the Train/Test Sets, and selecting which Algorithms to try out. (You will find further details in Dataiku’s tutorial).
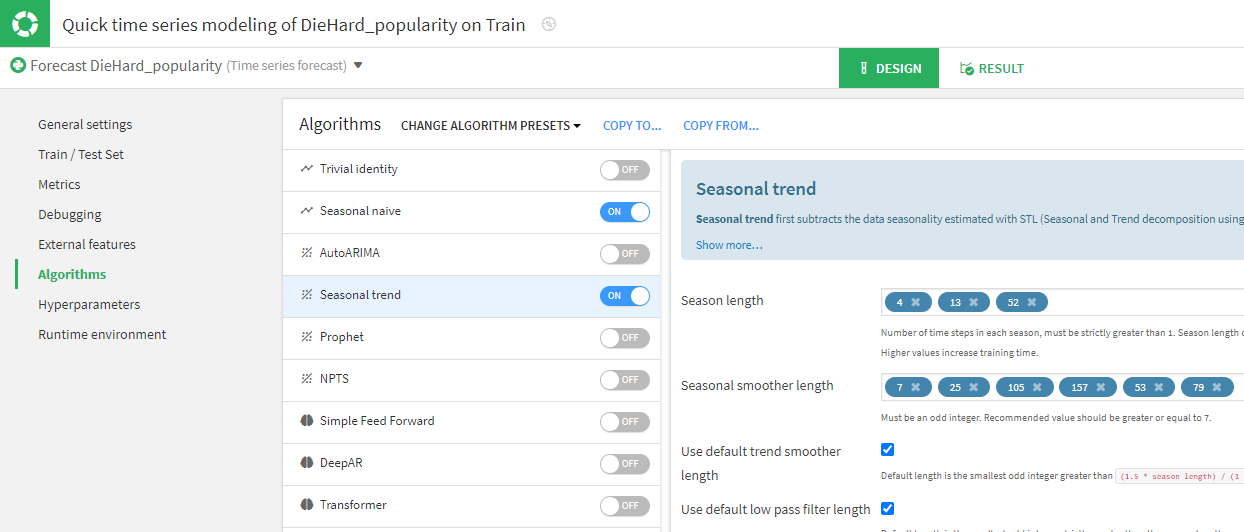
We experimented with many algorithms but found the Seasonal trend algorithm to consistently have the best performance. We made sure to make “52” one of the "Seasonal length" options to correspond to 52 weeks (one full year). We also adjusted "Seasonal smoother length" (25 was the best-performing option). To read more about the parameters for Seasonal trends, try this link from Dataiku.
Now that we have created the model, we can use it to make a Time Series Forecast for the next 13 weeks.
 Data Sleighs the Debate: Die Hard Popularity Peaks During the Holiday Season
Dataiku’s Time Series forecast (blue values on the far right of the Dataiku line chart) correctly identified the trend of Die Hard’s popularity spiking toward the end of each year. The forecast for the 2023 Holiday season is higher than 2022 but lower than 2021’s popularity. This aligns with our intuition from looking at the past 5 years of Die Hard’s popularity. Die Hard’s 100 (peak interest value) happened toward the end of 2020, then dropped a bit in 2021 with another drop in 2022.
The data shows that Die Hard’s popularity skyrockets during the weeks between Thanksgiving and Christmas every year with it peaking during the week of Christmas. Die Hard’s relative popularity is pretty much nonexistent in all of the other weeks of the year. Christmas movie or not, it appears that the broader population in the United States considers Die Hard to be a movie to watch during the Christmas season.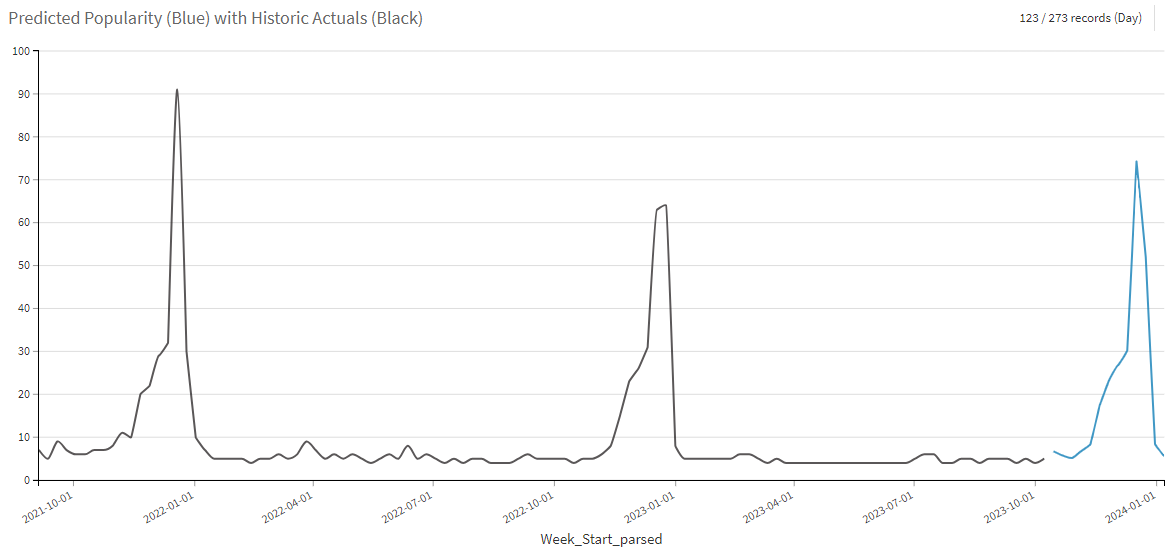
We’re Die Hard Fans of Dataiku’s Time Series Forecasting Tool
You don’t have to be a data scientist to see that the interest in Die Hard peaks around Christmas and is largely flat for interest the rest of the year. While this is a straightforward dataset, most things in business and life are not as cut and dry.
Companies can find a variety of uses for Dataiku’s Time Series Forecasting tool. Maybe there are products that your company sells which don’t seem to follow an obvious seasonal trend. Maybe you could use Dataiku to forecast future demand so you are prepared for your inventory needs. You might be surprised to uncover some trends you didn’t even know existed.
If you are a company that thrives on holiday sales and wants to maximize your sales and promotions at the right time each year, you could use Dataiku Time Series Forecasting to validate if shoppers are shopping earlier in the season and if that could be the case for your business as well.
You could use Time Series Forecasting for Financial applications in business to forecast cash flow and see what times of year are better than others. Using Dataiku can help automate your current processes and improve accuracy.
Perhaps you are in product development and want to find product popularity trends seasonality to products in that segment. This detailed information could help set productivity deadlines and efficiencies throughout the production process.
It’s Hard to Argue With Results
While we may not have officially solved this holiday movie debate, it’s hard to argue the fact that Dataiku offers a unique tool to help us use data to forecast and uncover answers to all sorts of interesting questions. No matter what your use case is, Time Series Forecasting in Dataiku is fast, user-friendly, and powerful for your business.
Ready to try it out? Download the Dataiku project and data used in this article or visit our blog for more insights from our experts.
| FEATURED AUTHOR: JON JORGENSON, SENIOR DATA CONSULTANT
-1.png?width=290&name=Blank-Template-Facebook-Post%20(2)-1.png)