


For years, there has been a debate among NBA fans about whether there is a distinction between player focus and intensity levels in the playoffs versus the regular season. It is perceived by some that players tend to exhibit a higher level of focus and intensity during the playoffs. Various factors of debate contribute to this such as higher stakes, more attention to detail, shortened rotations leading to more playing time, and increased physicality. Although all of these factors of discussion could be true, what does the data say?
LeBron James is one of the most known current players in the league. As an all-time leading scorer in the NBA with 17 total playoff appearances and close to 300 playoff games played, LeBron is a perfect test subject to measure if a player's focus and intensity levels increase in the playoffs.
In this article, we will use weighted averages which are used to assign different weights or importance to individual data points when calculating an average. The measurement of what constitutes the most or least amount of weight in the calculation can be hard to determine or agree upon. Through a bit of data exploration and analysis, you can determine which variables hold the most weight over different periods of time. Using weighted averages over time in Dataiku, we will try to answer a common argument: Are NBA players, specifically LeBron James, more focused in the playoffs in comparison to the regular season?
Data Description and Cleaning
Game statistics at the end of each quarter (a game has four quarters) can be found on the website statmuse.com. There are other data sources such as basketballreference.com and nba.com but those sources only provide end-of-game statistics. Since we are trying to measure intensity level, looking at quarterly data is a better reflection because it can measure more closely things like momentum shifts, substitution patterns, in-game adjustments, fatigue, and sense of urgency. The statistics we will use in our analysis are points, assists, rebounds, steals, blocks, turnovers, and plus/minus (which calculates point differential and their own statistical impact when the player is on the court). The data is split into two datasets: regular season and playoffs. The playoff data consists of LeBron playing three games a week. For a fair comparison, we use an “if-then” statement in Dataiku and only the dataset for games where LeBron James was playing three games a week in the regular season.
Data Analysis Through Weighted Averages
Instead of just measuring basic statistics like sum, averages of points, or assists, we wanted a more complete scope of what we will call “effort level”. I created two weighted averages to accomplish this. In the context of basketball statistics, weighted averages can be applied to account for the player's impact on the court. The two weighted averages I created are interpreted as followed:
Offensive Efficiency
Offensive Efficiency is heavily weighted on scoring. The variables that carry the most weight are points and a variable called shot efficiency, which calculates field goals made against field goal attempts with three-pointers carrying twice the weight. An additional weight is turnovers which are doubled and go against offensive performance (shot efficiency, points, and assists).
Offensive Efficiency = ((Shot Efficiency + Points + Assists) - Turnovers x 2 + Plus/Minus ) ÷ Minutes Per Quarter
*Shot Efficiency = (Field Goals + (3 Pointers x 2)) + ((Field Goals - Attempts) + ((3 Pointers - 3 Attempts) x 2 ))
Hustle Efficiency
Hustle Efficiency factors in how the player can impact the game outside of points and assists. Rebounds, steals, and blocks are all equally weighted.
Hustle Efficiency = (Rebounds + Steals + Blocks + Plus/Minus) ÷ Minutes Per Quarter
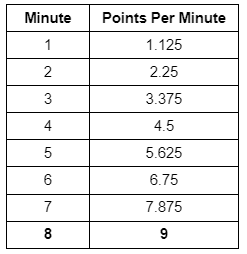
The weighted averages will be broken down on a per-quarter basis and a per-minute basis. The data is already set up for quarterly analysis however, the per-minute sequences are a bit more complicated. In Dataiku, we used a Python recipe to accomplish this by calculating the incremental increase in points based on the average points per minute. This is over the total minutes played in a three-game period per week which is around 120-130 minutes played. For example, say LeBron James has nine points for eight minutes played in a quarter which is an average of 1.125 points per minute. It then provides the cumulative value over an eight-minute period:
Data Visualization and Interpretation
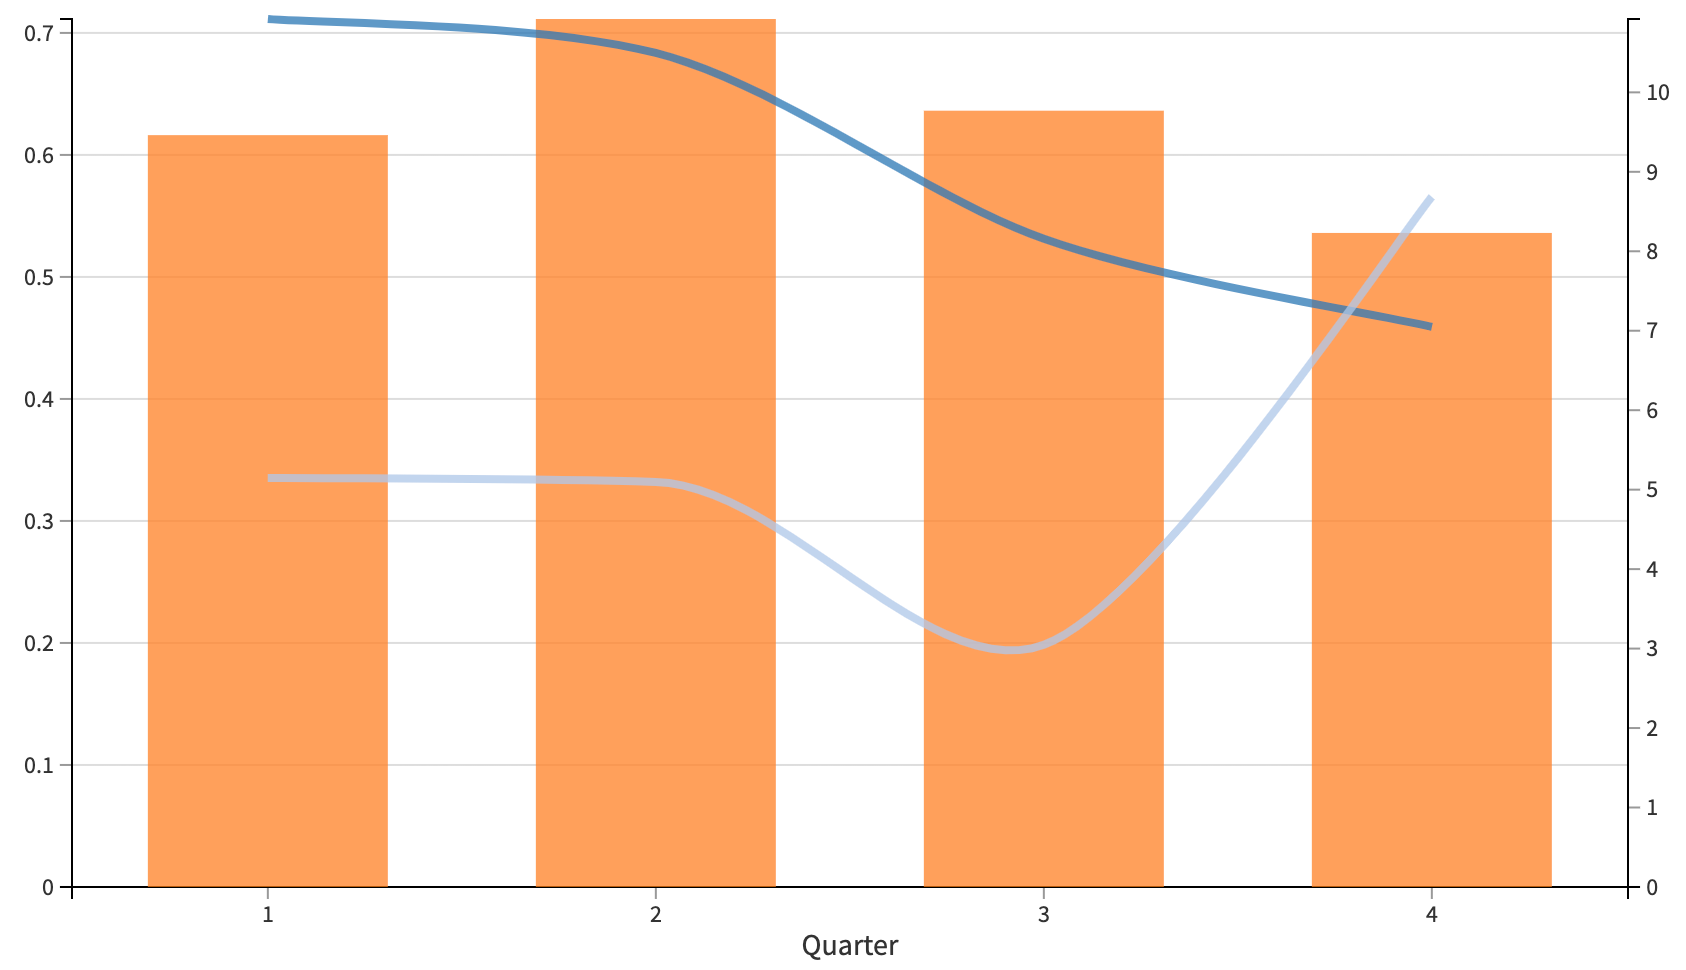
In the charts below, we look at LeBron James’ 2023 season taking the average minutes and average efficiency ratings of offense and hustle weight averages by quarter. In Dataiku’s charting feature, we can generate a combo chart and filter by the season for the playoffs and regular season. The left y-axis represents the average efficiency rating (both offensive and hustle) and the right y-axis represents the average minutes played per quarter.
Efficiency By Quarter 2023 Playoffs:
.png?width=227&height=65&name=Index%20for%20Graph%201%20and%202%20(can%20use%20it%20for%20both%20screen%20shot%201%262).png) Efficiency By Quarter 2022-2023 Regular Season:
Efficiency By Quarter 2022-2023 Regular Season:
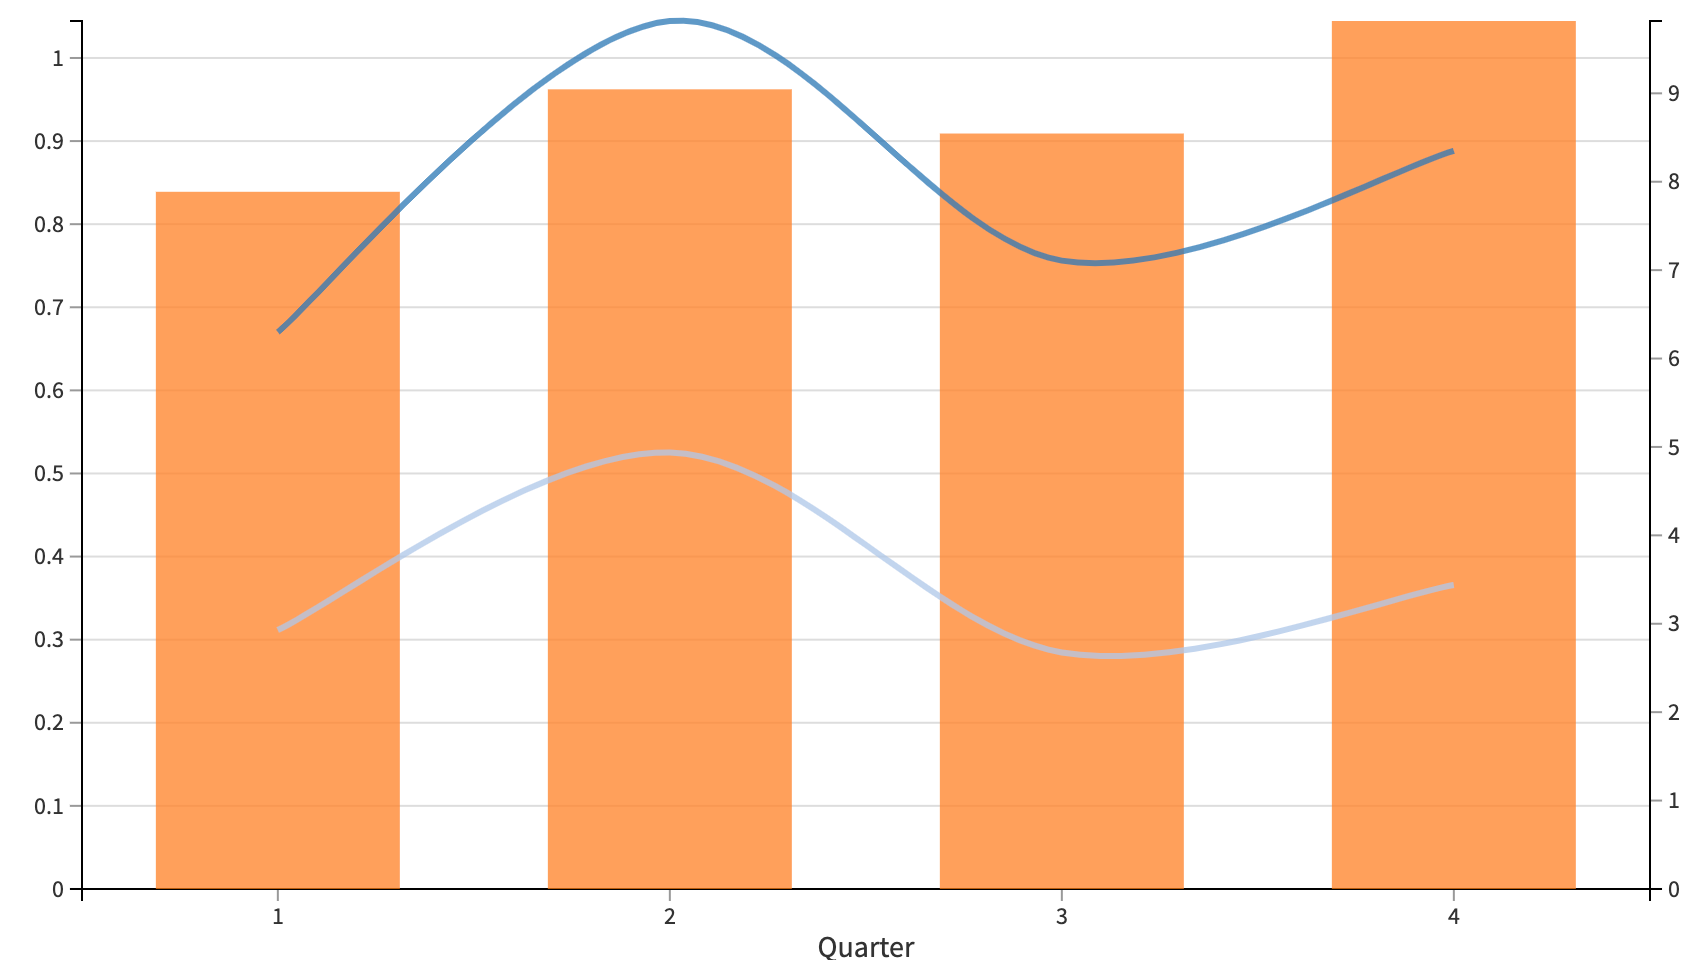
When comparing these visualizations, you can see that LeBron’s average offensive efficiency rating (dark blue line) is actually better in the regular season than in the playoffs, but the hustle efficiency rating (light blue line) – specifically later in games – increases more in the playoffs. From these two graphs, one could wonder whether LeBron might be more focused in the second half of games in the playoffs and if that could maybe negatively affect his offensive performance to close out a game. LeBron averages roughly 1-2 minutes more per quarter in the playoffs (outside of the 4th quarter) which could potentially drive down the weight of his offensive efficiency. There are also factors like fatigue or lingering injuries that could drive down his shot percentage and offensive efficiency rating leading him to impact the game in other ways. Let’s take a closer look at some of these hypotheses.
Average Points, Assists, Rebounds, and Offensive Efficiency - 2023 Playoffs:
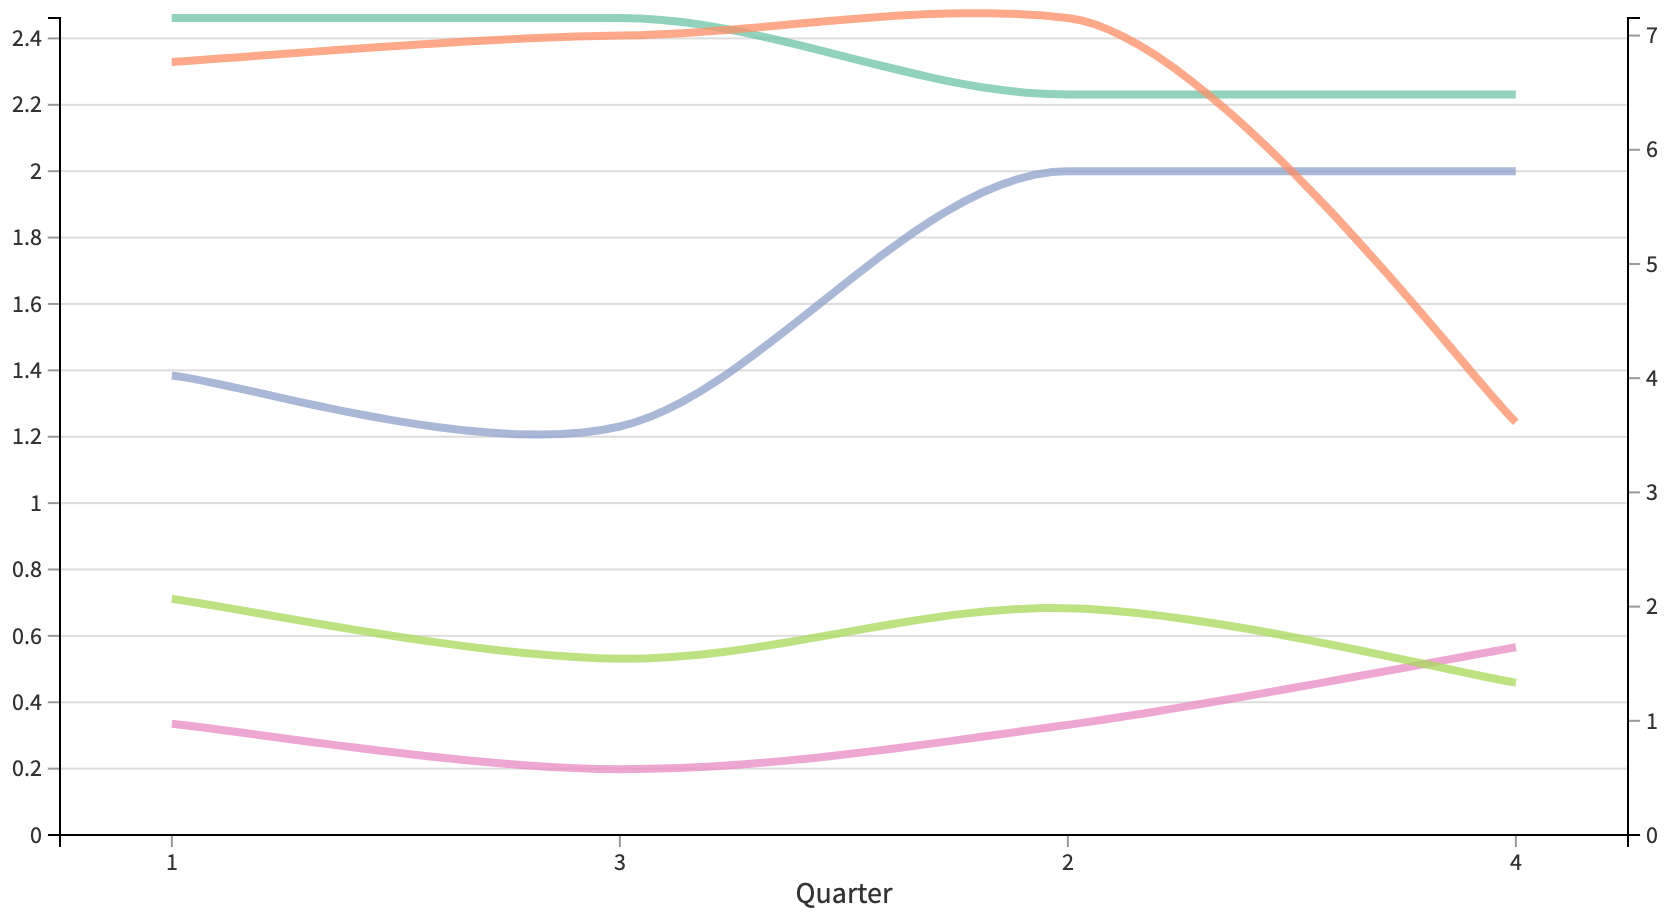

Average Points, Assists, Rebounds, and Offensive Efficiency 2022 - 2023 Regular Season:
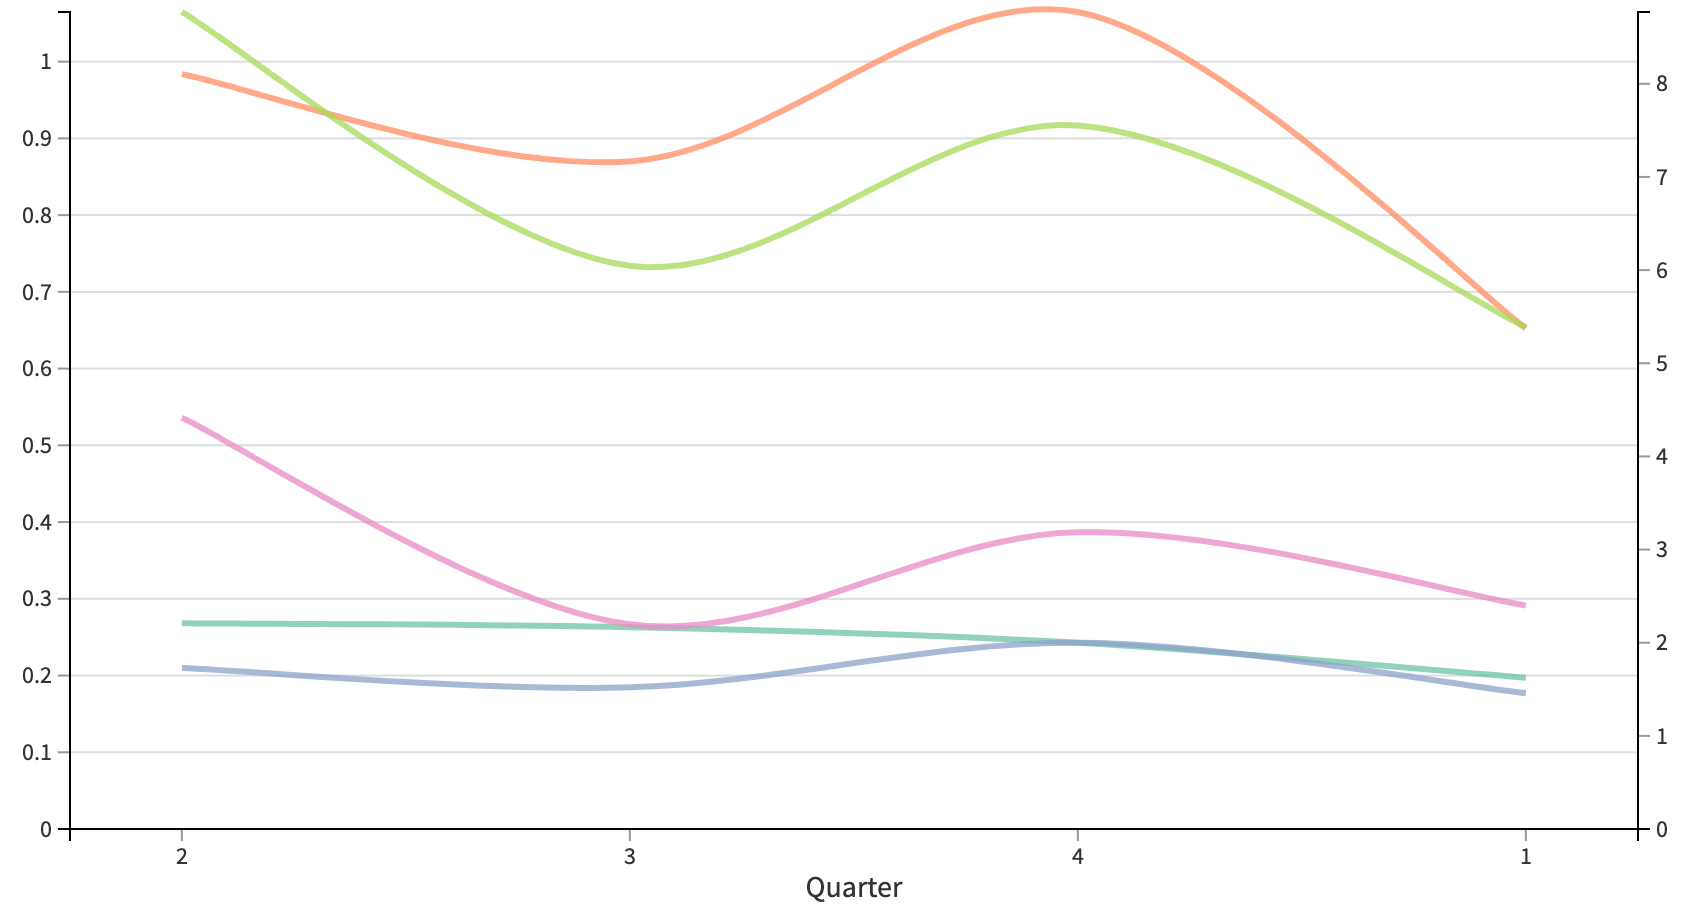
When comparing averages per quarter between the playoffs and the regular season, we can see that despite LeBron’s point averages dipping lower, specifically in the fourth quarter in the playoffs, his rebounds and assists are much higher in the playoffs compared to the regular season. Of course, there might be extraneous factors influencing these statistics, however, from looking at this example, we can determine that LeBron does increase his focus level in the playoffs but it is not always reflected in his scoring. This also could mean that our offensive efficiency weighted average might be too heavily weighted on points.
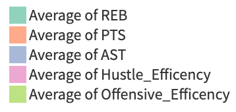
Total Cumulative Weighted Average Over a Three-Game Regular Season Period versus a Three-game Playoff Period for the 2022-2023 Season.
Now let’s look at the cumulative data which sums the data values over a three-game period on a per-minute basis. We apply our weighted averages to these cumulative data series and plot the results over time (minutes played). Note, we are looking at LeBron James and comparing the same season 2022-2023 playoffs to the regular season.
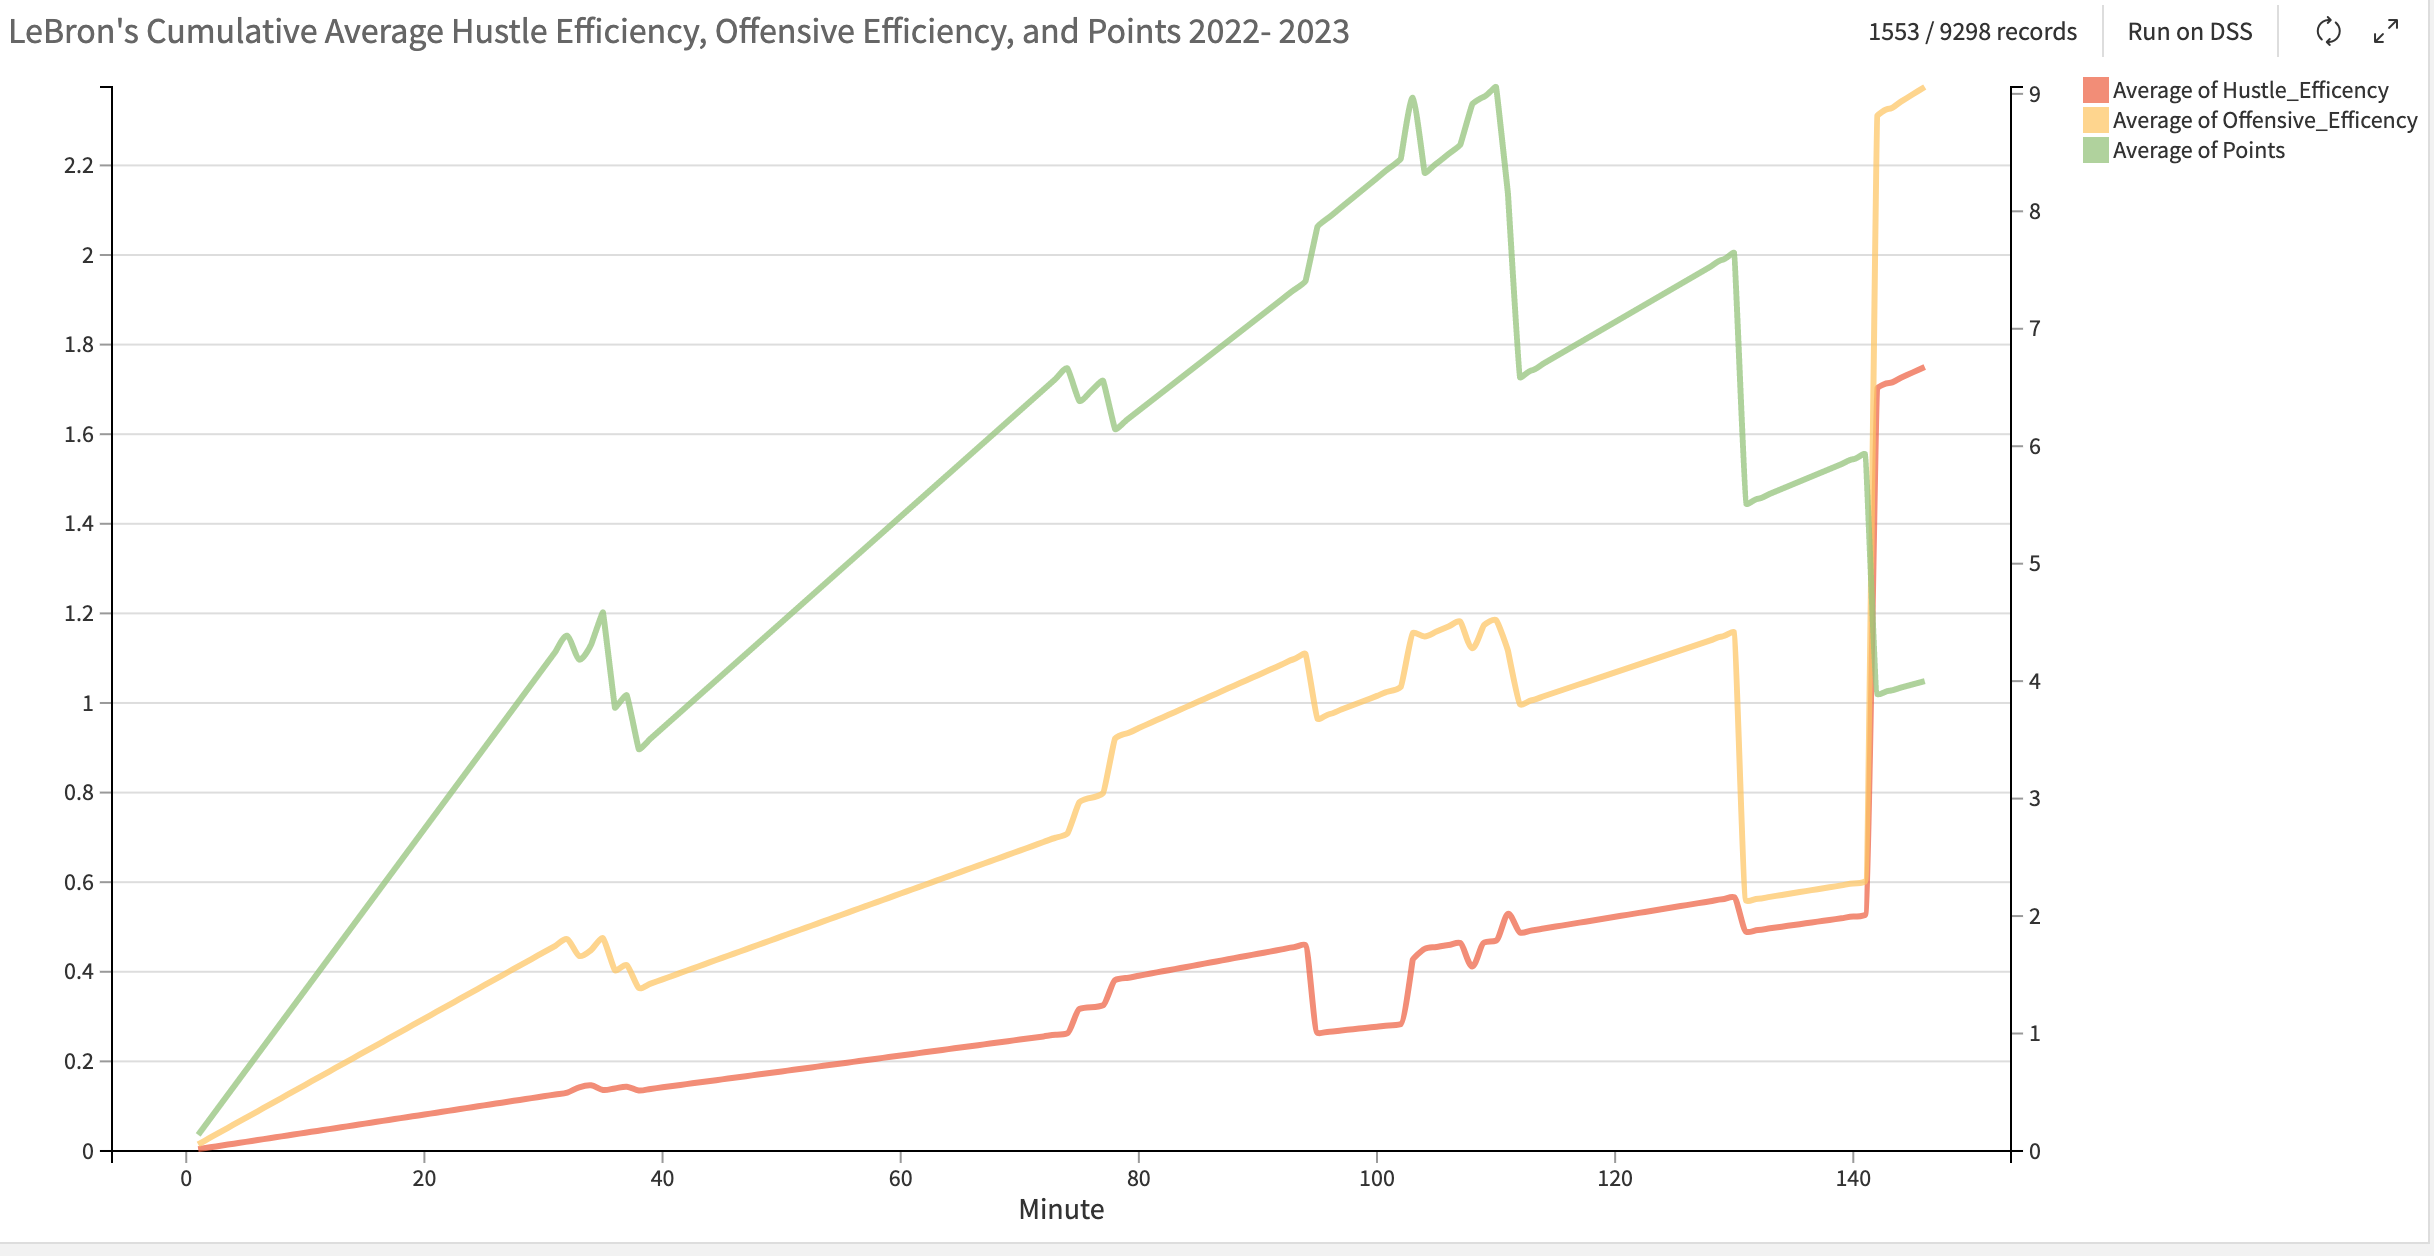
When looking at the line chart, we can see that points scored hold less weight than when we measured the weighted averages by quarter and we even see a negative correlation between points scored and offensive efficiency. Looking further, we determined that turnovers were driving the offensive efficiency down during these negative correlation periods:
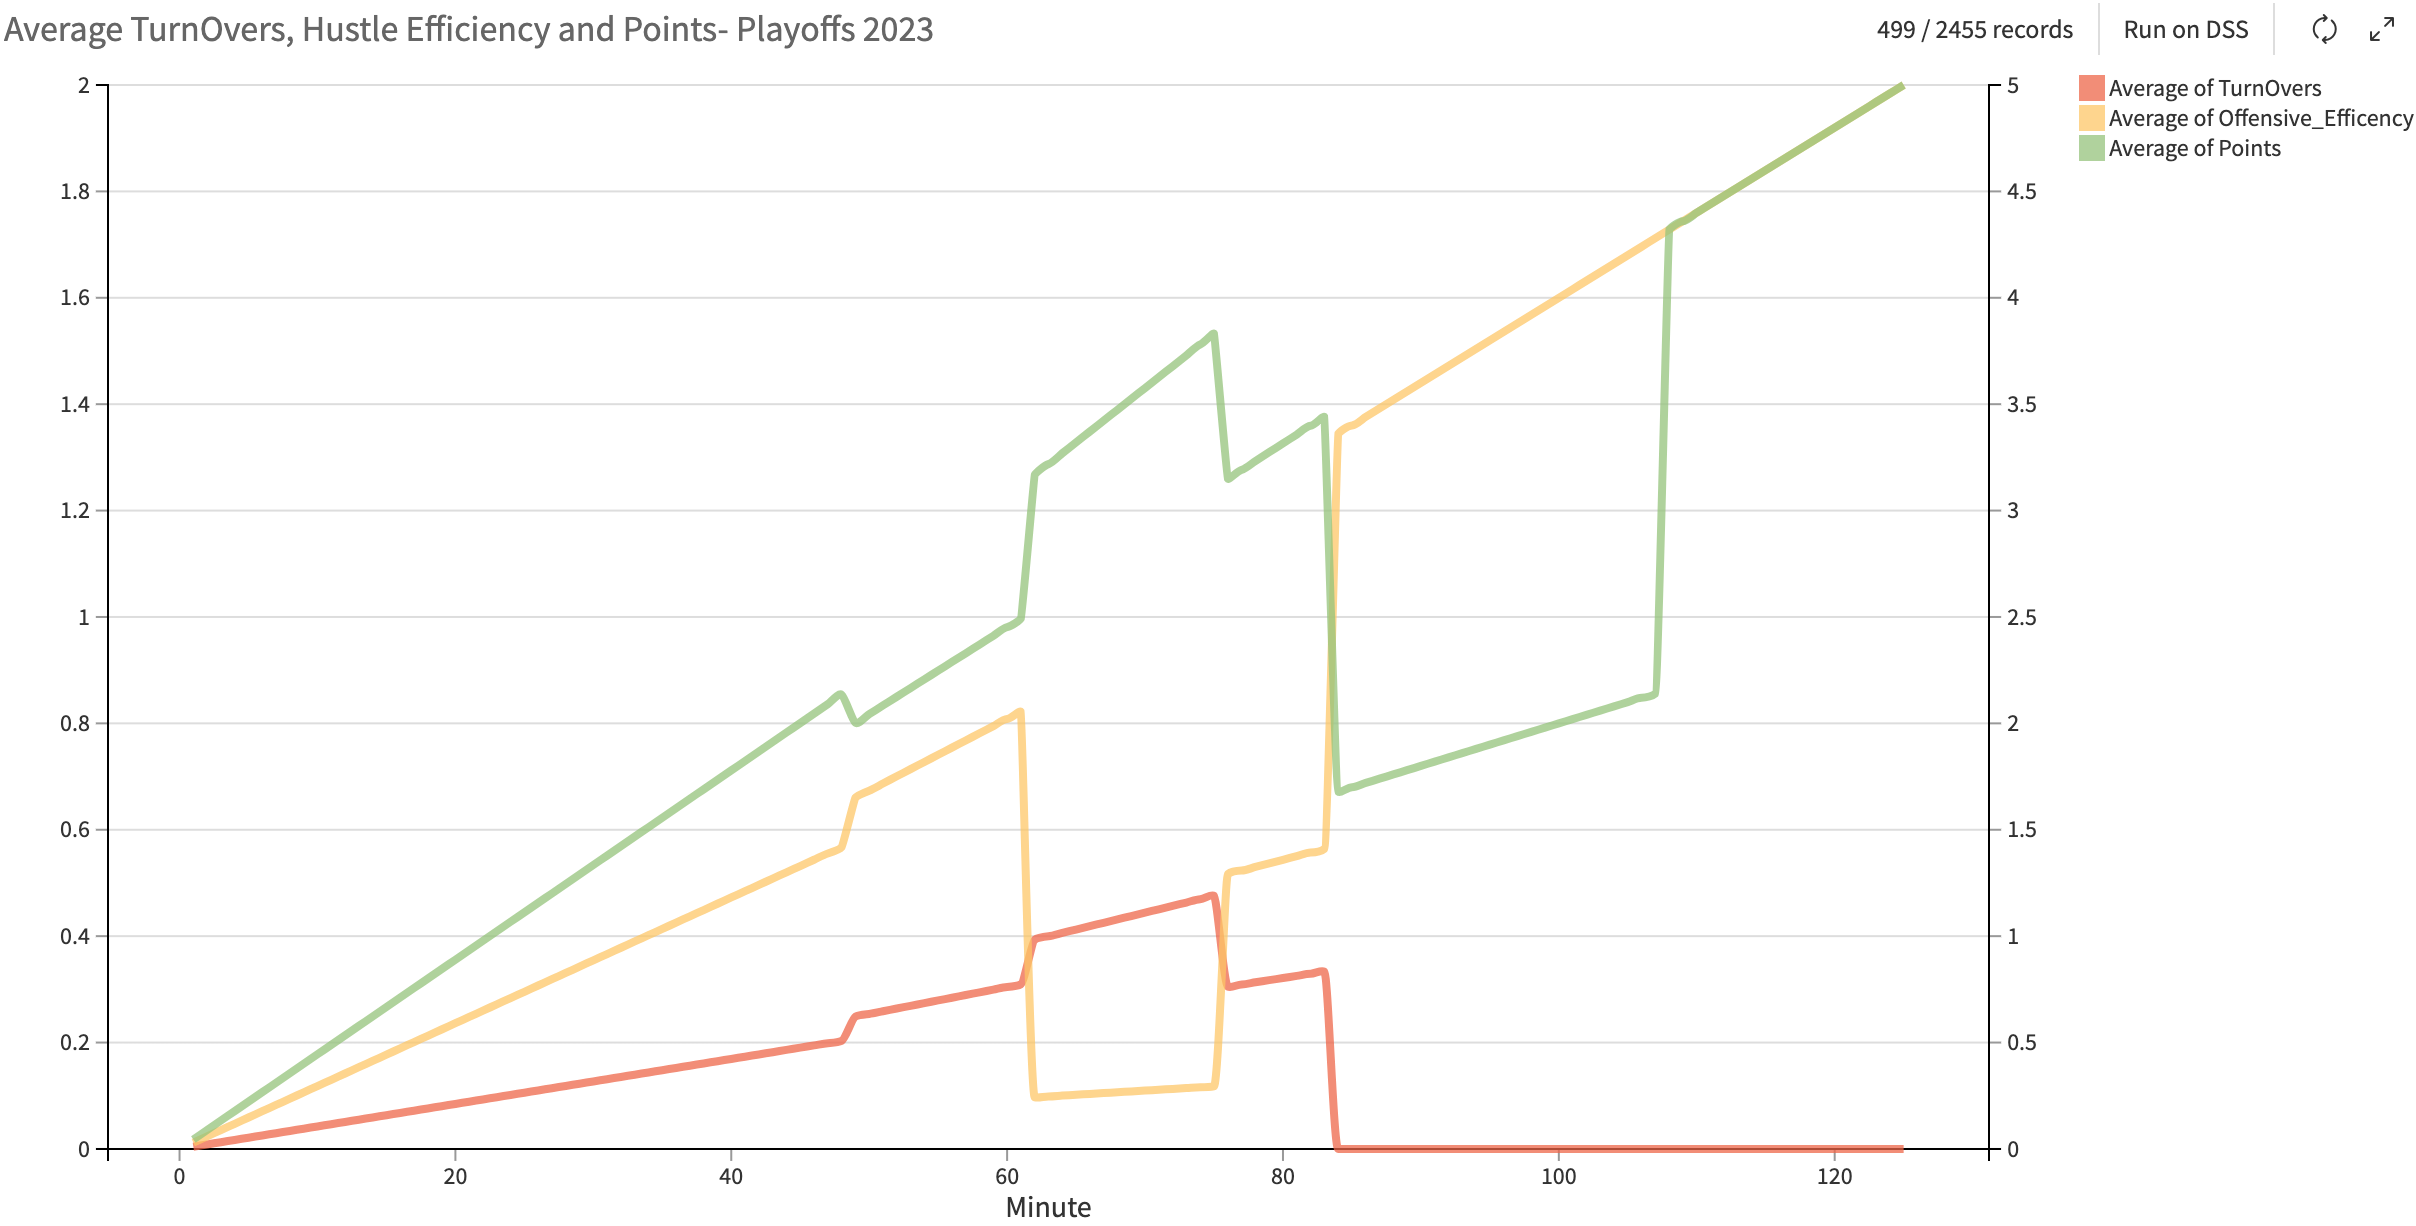
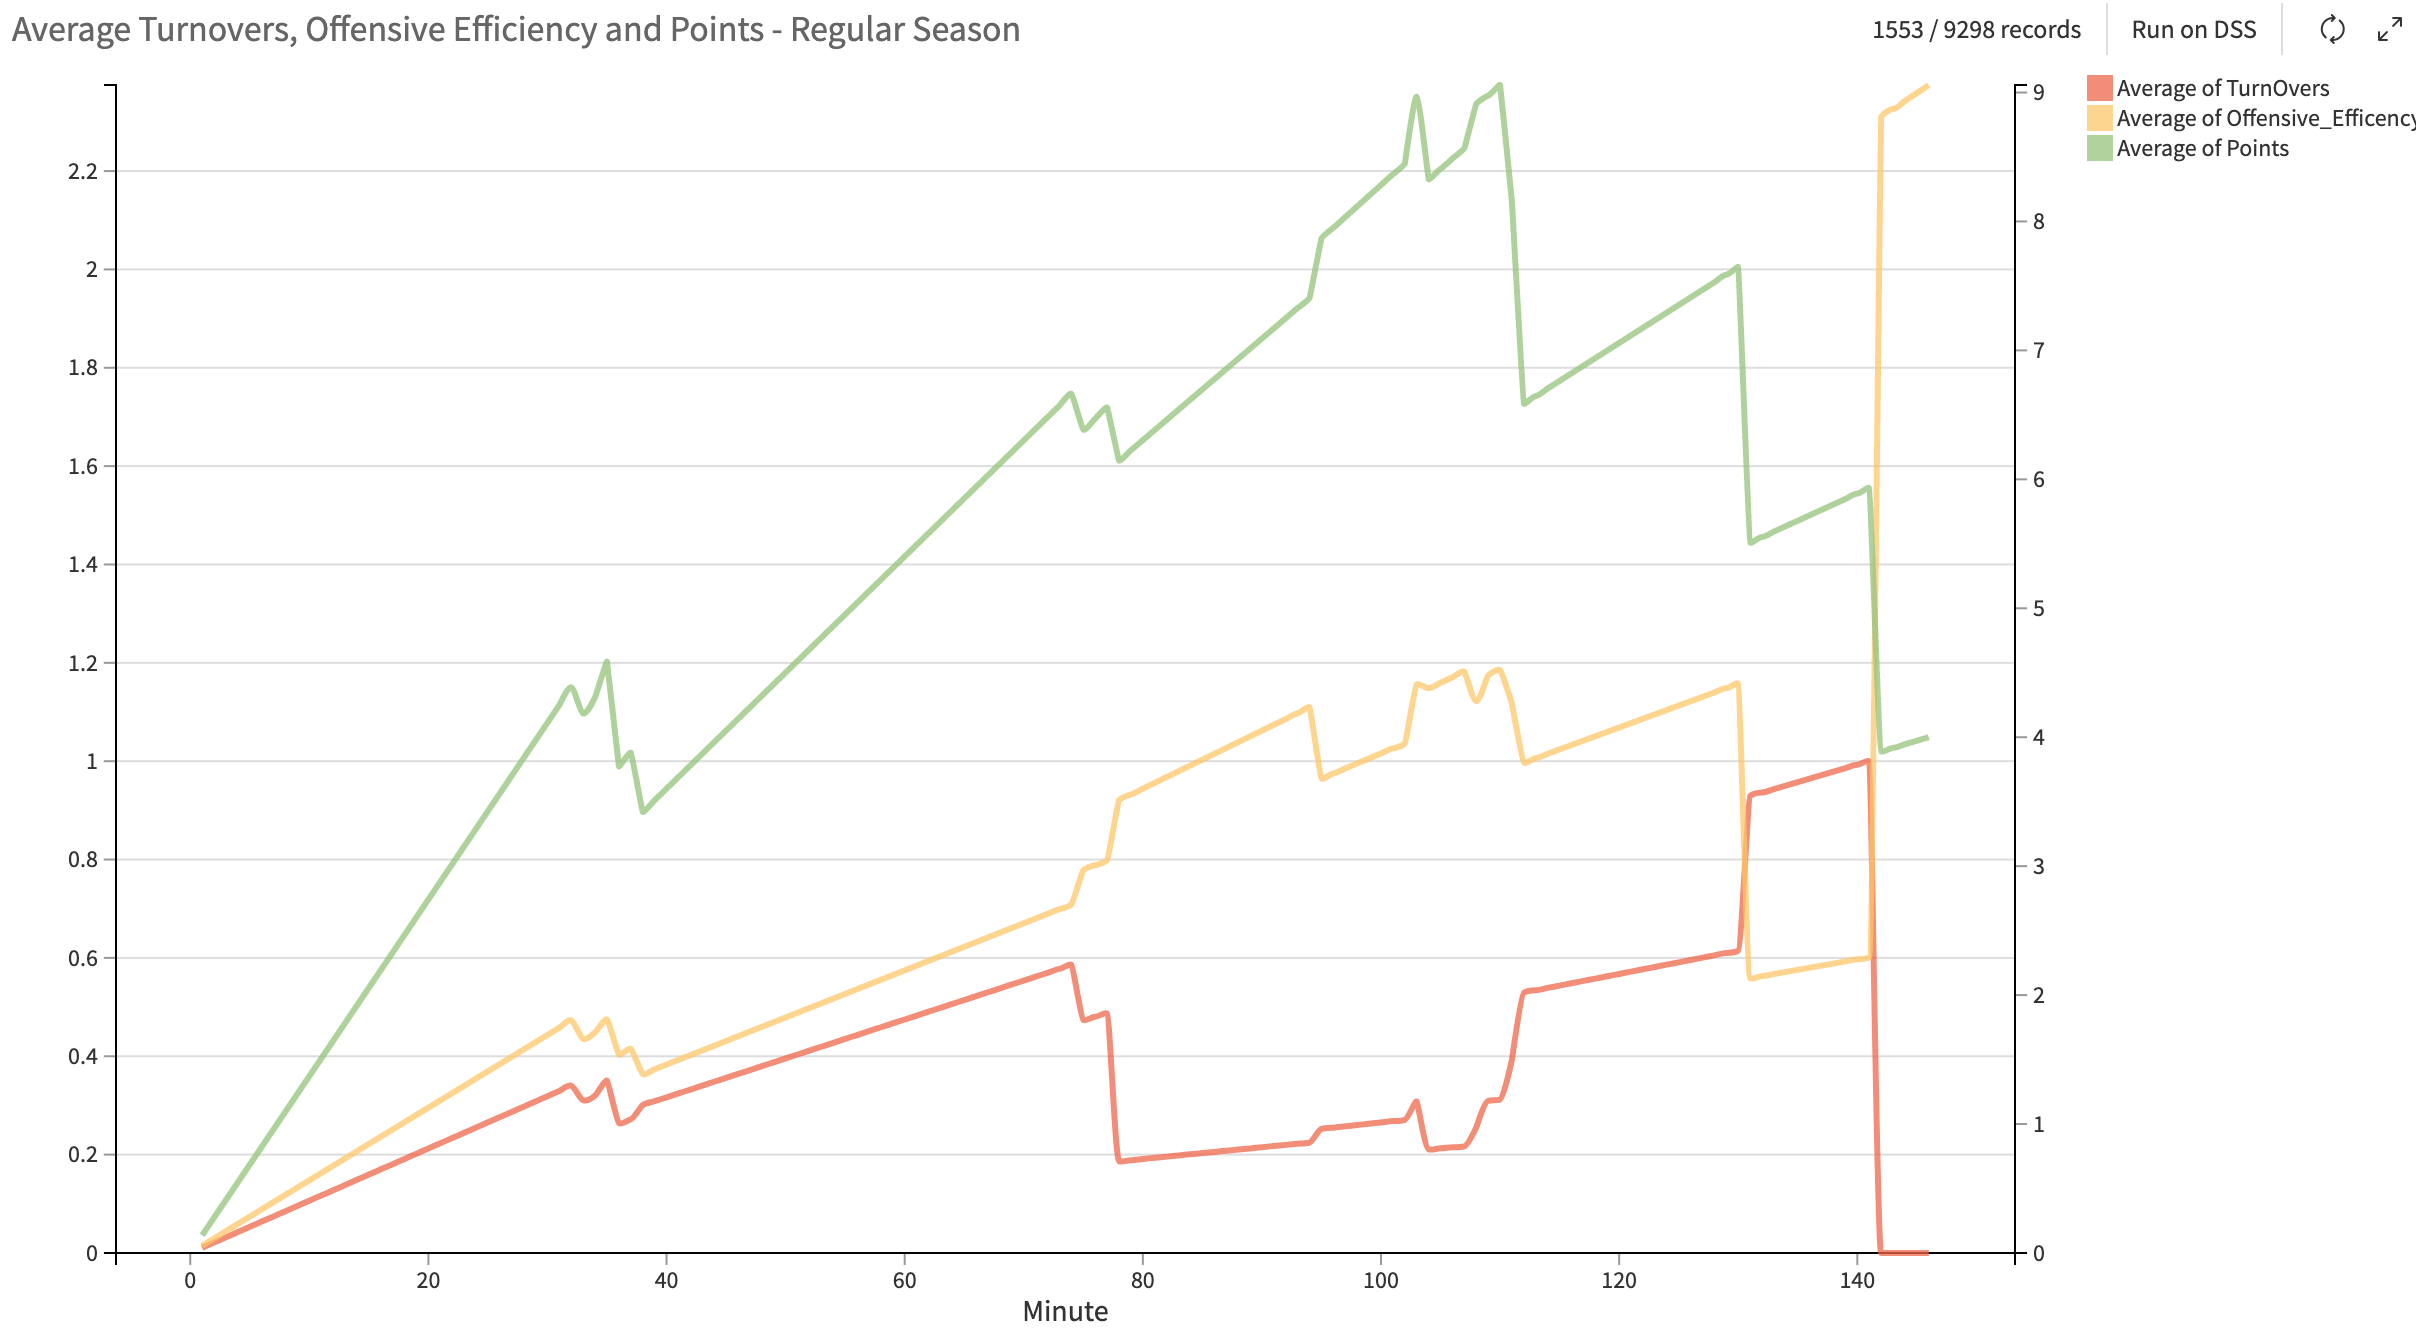
Comparing the regular season and playoffs with the cumulative average over a three-game period, we can see that LeBron James’ scoring is still better in the regular season than in the playoffs with his offensive efficiency slightly better outside of the final minute marks. The greatest difference is found in his hustle efficiency, which outside the 62-75 minute range is much higher in the playoffs than in the regular season.
The Final Answer to Our Question
As with any real-world data analysis, there are hidden biases and additional considerations. Here we’ve noted a few, such as defining our player metrics and accounting for game dynamics (i.e., other players and strategies). Another often overlooked bias is with data sampling, and we noted that we are only using games from three-game weeks, but also only seasons where they made the playoffs. One can quickly see an abundance of opportunities for additional analysis to explore.
In the end, our results concluded that on weeks in the regular season where LeBron James is playing roughly three games, his rebounds, blocks, and steals (hustle efficiency) are lower than in the playoffs. Alternatively, his scoring is higher than in the playoffs. His offensive efficiency has a slight advantage in the playoffs but his scoring is lower, so by our weighted average we conclude that his assists, plus/minus, and (or) shot efficiency is higher in the playoffs than in the regular season. This isn’t surprising considering that the stakes are higher in the playoffs so he is more of a target for the opposing teams’ defense, leading him to find other ways to impact the game outside of scoring (especially an increase in assists, rebounds, etc.).
To answer our question: Does LeBron's focus and intensity level increase in the playoffs compared to the regular season? The answer isn’t as clear-cut as many would think, but based on this analysis, the data suggests his level is only slightly higher in the playoffs than in the regular season.
Ready to learn more? Find out how we used Dataiku and the Elo rating system to predict the winner of Super Bowl LVII.
| FEATURED AUTHOR: TREVOR CRAIG, DATA SCIENTIST
-1.png?width=290&name=Blank-Template-Facebook-Post%20(2)-1.png)