


Collaborative Data Tools
In the ever-expanding Data Science universe, the need for powerful, collaborative team tools has never been more essential. In the past 5 years, Dataiku has emerged as a market leader in Data Science orchestration and is the leader in including technical and non-technical roles in collaborative projects. For technical users, Dataiku provides the power of Jupyter notebooks out of the box for Python code development — but for those requiring more flexibility, it’s also possible to integrate directly with the PyCharm IDE and debug on your desktop.
Let's walk through the configuration and setup of PyCharm and a Dataiku DSS Design node as well as code modification and the execution of a debugging session.
Note: Dataiku integration with PyCharm will not be possible if you’re using the Free (Community) edition of Dataiku, which does not allow for API integration.
DSS Project
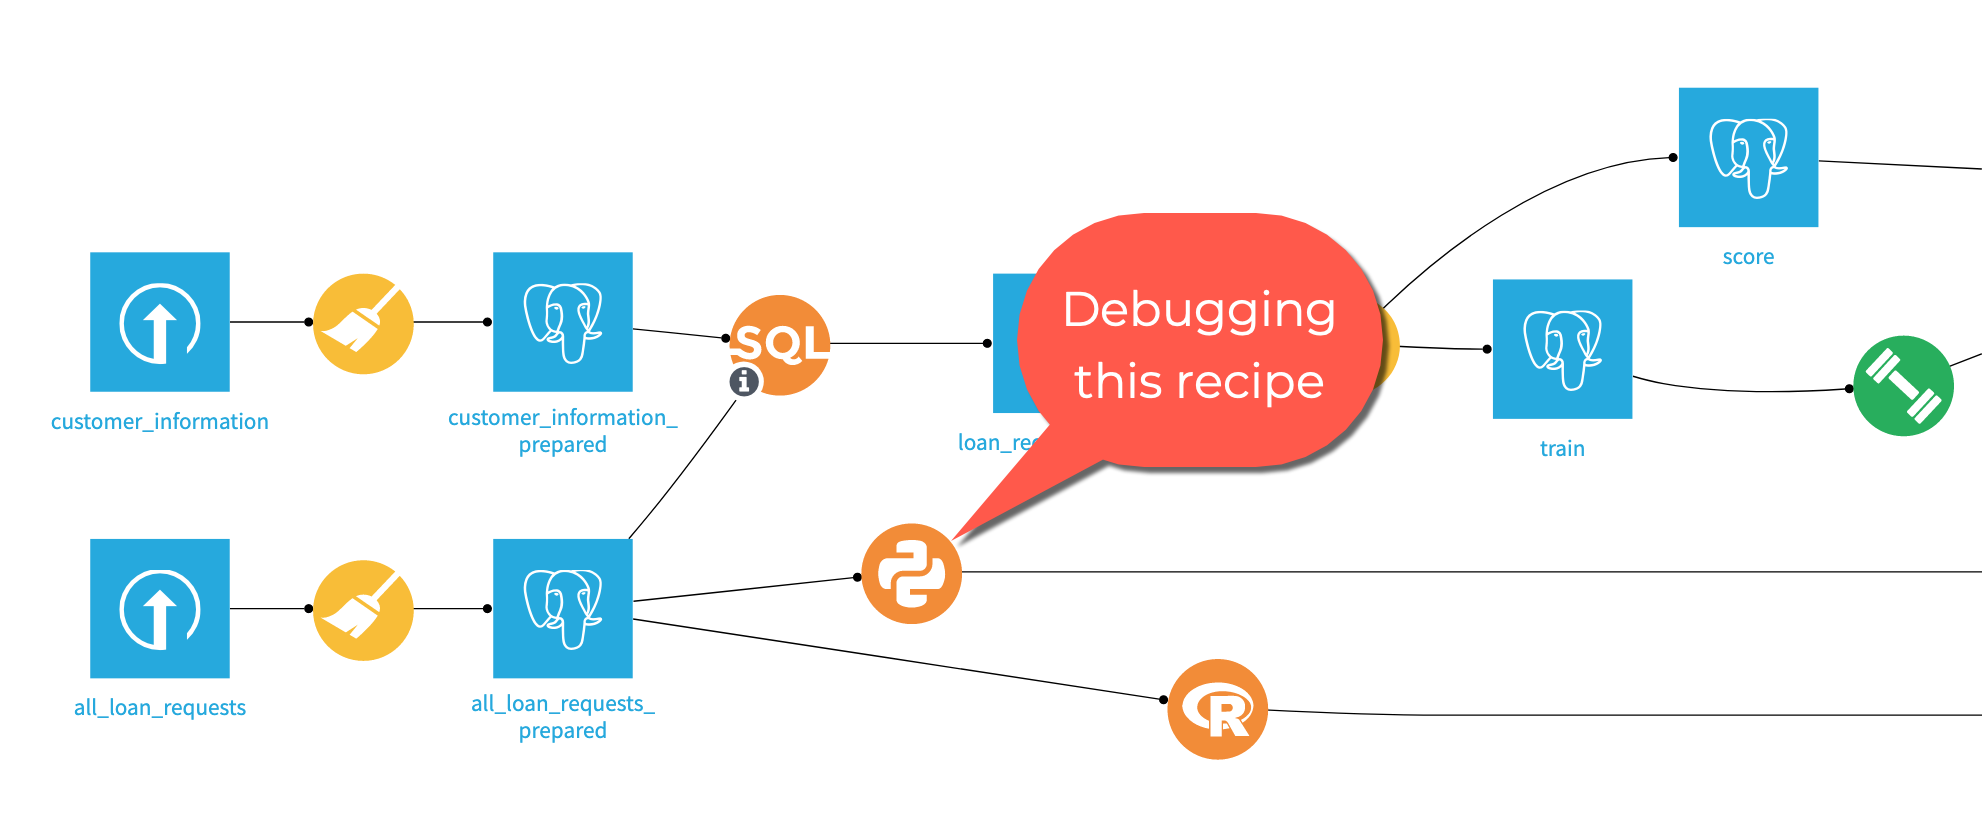
This Dataiku project example has a single Python recipe that we’d like to connect to with PyCharm and debug interactively. With this integration we can also edit DSS Plugins, SQL Recipes and R Recipes with PyCharm.
Install the Dataiku Plugin Extension
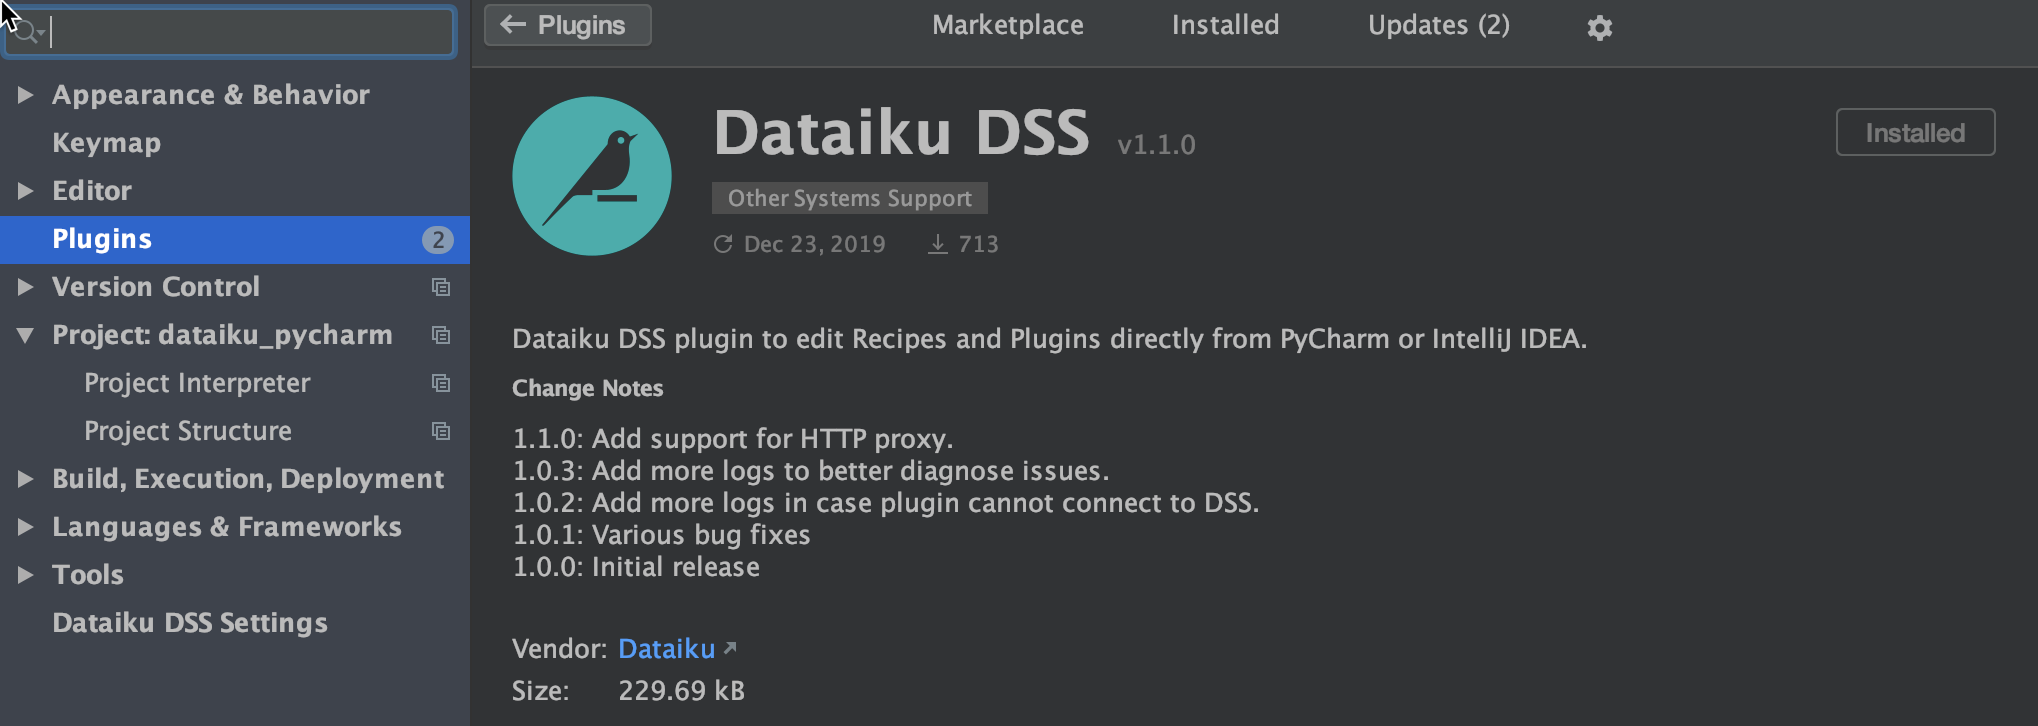
Assuming you already have PyCharm installed (the Community Edition will work just fine for this tutorial), the first step required to integrate Dataiku is to install the Dataiku Plugin from the marketplace. Simply search for “dataiku” and then click “Install” on the Dataiku DSS plugin result.
Once you have the extension installed, you’ll want to configure it to integrate with your Dataiku Design Node instance. To do this, open the preferences panel as shown in the following screenshot and navigate to the “Dataiku DSS Settings” tab. From this screen, click the “+” to add a new DSS Instance.
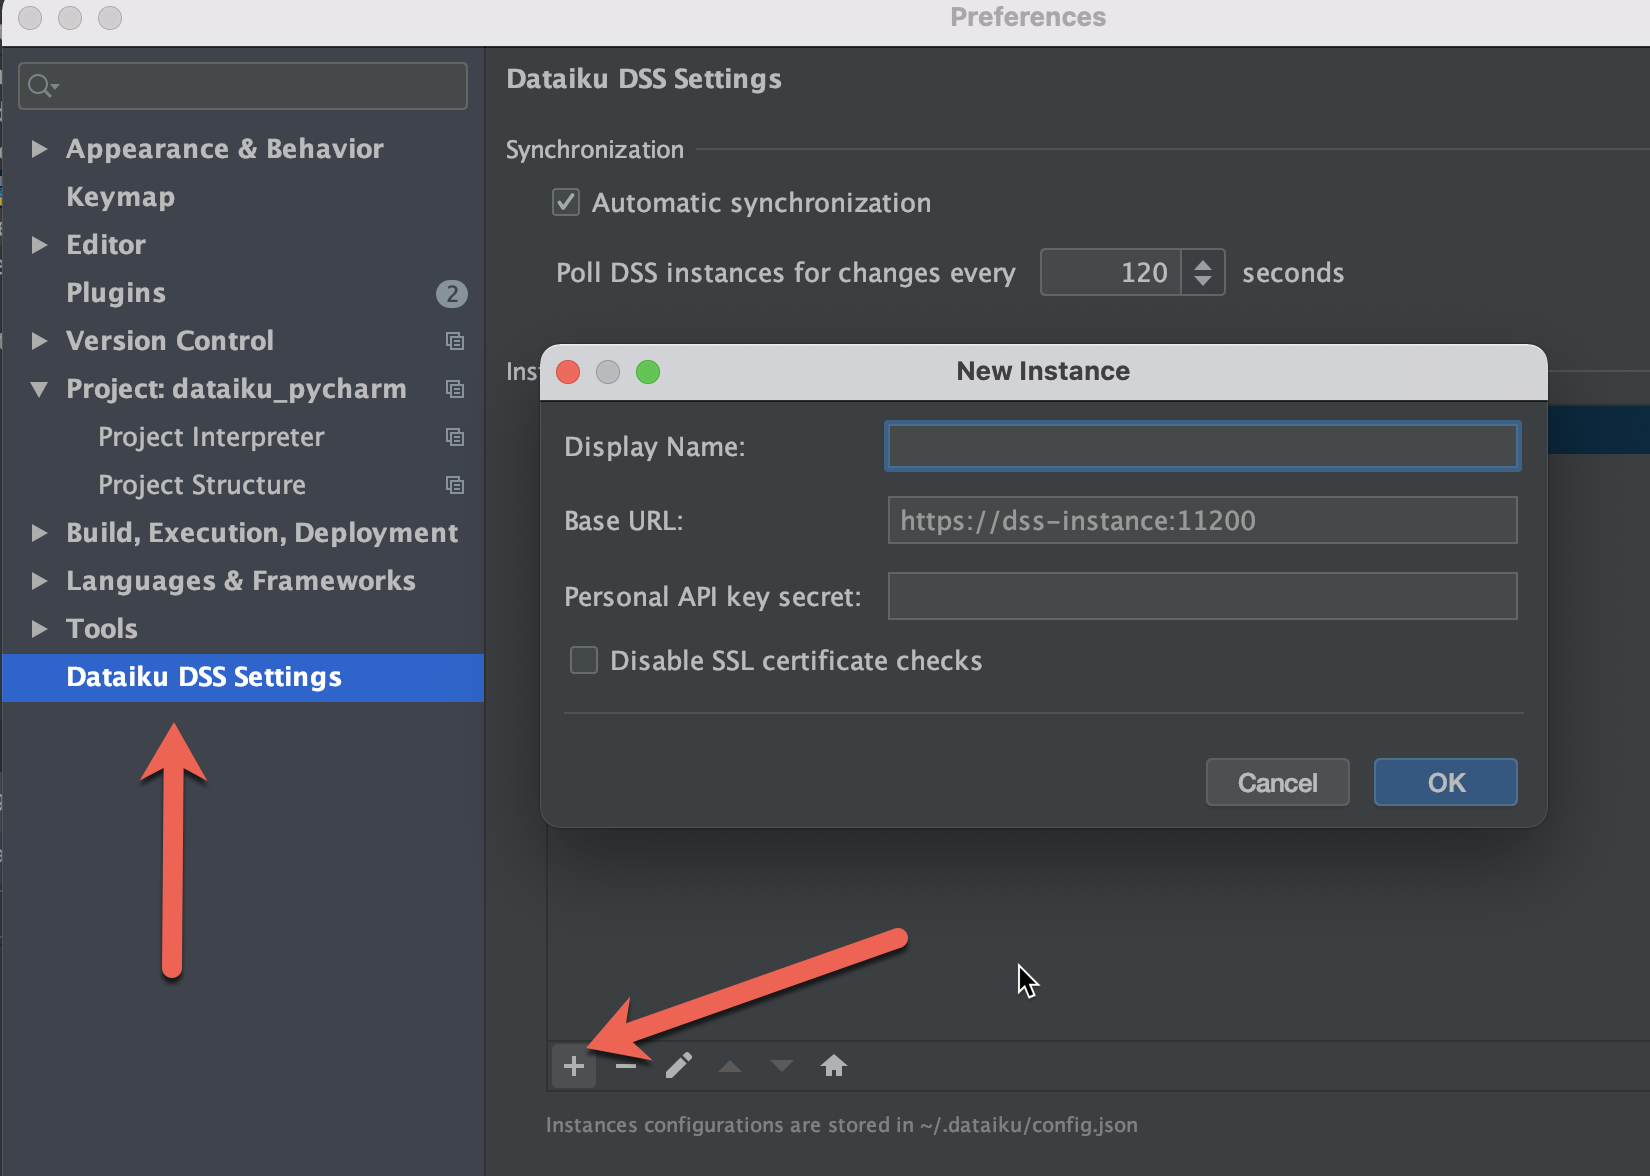
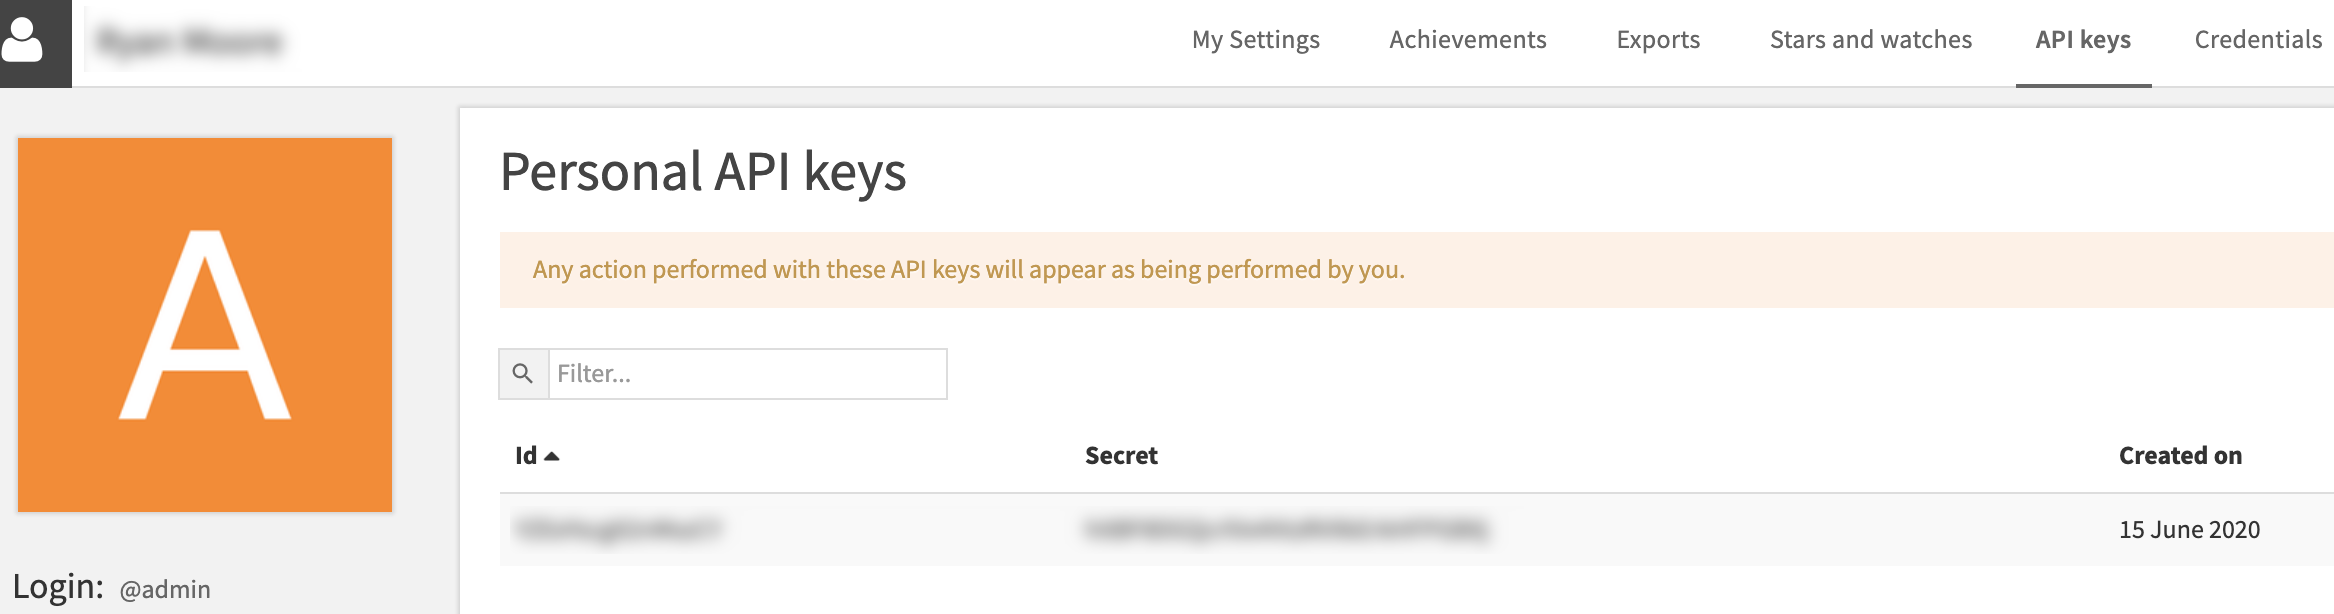
The “Base URL” is simply the http(s) url to the Dataiku Design node you’d like to connect. For those unfamiliar, the API key is the “Secret” value found under the “API keys” tab in your Dataiku user profile.
It's all about the Environment
If you’ve done much Python development, you’re likely familiar with virtual coding environments. In Dataiku, we’re able to create custom Code Environments for our plugins and scripts using the Code environment tab in the Administrative panel. When we integrate with a DSS Design Node instance from PyCharm, we want to create (at least) one PyCharm project for each DSS Code Environment in order to run our code locally.
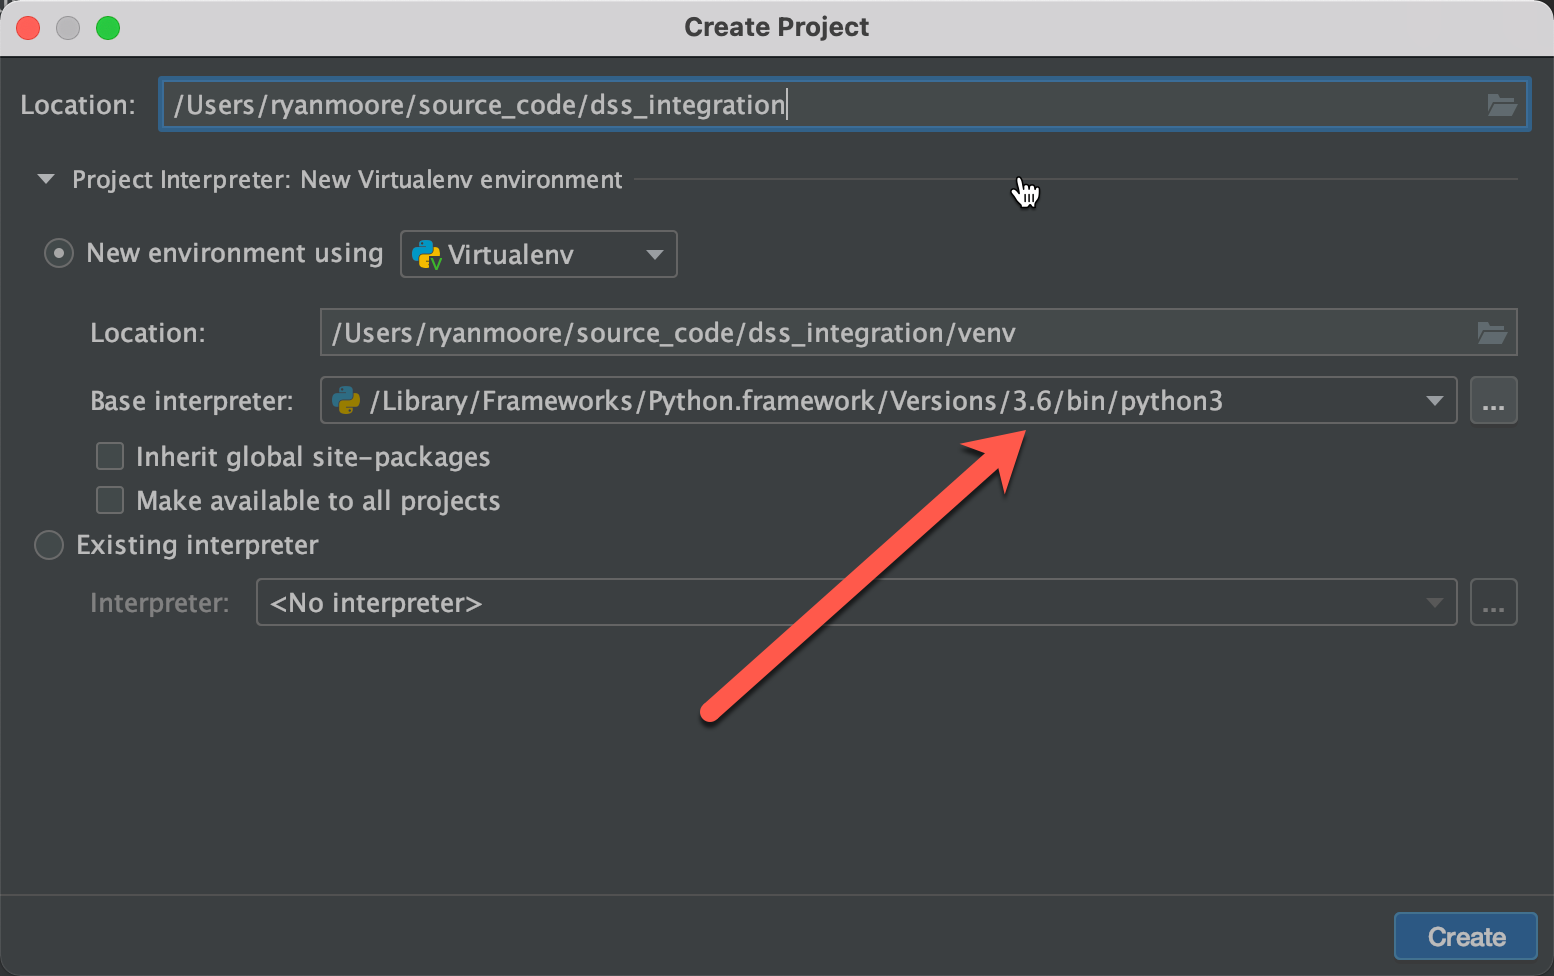
With the DSS plugin installed, we’ll create a new project in PyCharm that will align with one of the Code Environments you in your DSS instance. For example, in my instance, I have a Python 3.6 environment with no custom PIP packages installed. To re-create this environment locally, I’m going to start a new PyCharm project and select the “New Virtual Environment using Virtualenv” option, using the same Python version that I’m using in DSS. If you are using Python 2.7 in your DSS environment for example, you’ll want to select a path to a local Python 2.7 install.
Create a PIP requirements file
Now that we’ve created a PyCharm project with a new Virtual Environment, the next step is to create a requirements file which will define the PIP packages that are required to debug our files.
In your project, create a new text file with the File=>New=>File menu. In this file, we’ll be putting a couple essential packages needed for this integration, along with all of the PIP packages used in the DSS code environment that is used by your remote script. Name this new file requirements.txt
Listed below are the packages that are essential to run any local environment. Again, you’ll also want to add any additional PIP packages used by your Python recipe. Add these lines to your requirements.txt file:
dataiku-api-client
pandas
numpy==1.19.3 # for windows, MUST be 1.19.3 until bug fix in 1.19
With this file created, we’re now ready to open a file from our remote DSS instance in PyCharm.
Opening a Python Recipe from DSS
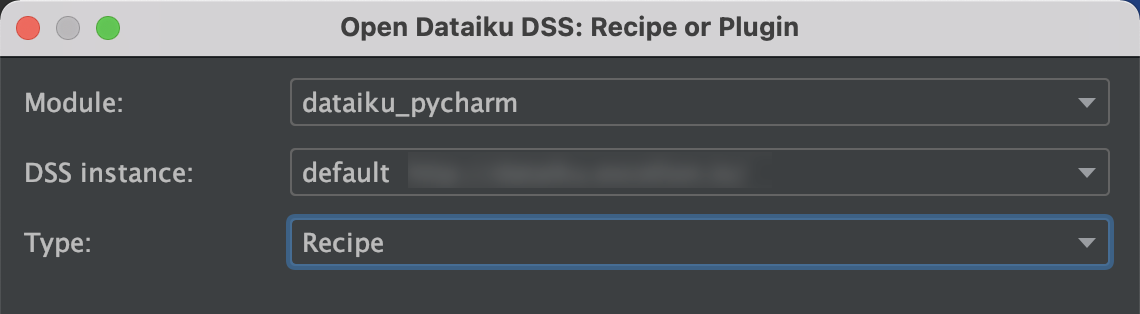
With the DSS Plugin installed, pulling Python files from your Dataiku flow is integrated right into the PyCharm menu. Navigate to File=>Open Dataiku DSS, and if your plugin has been configured correctly, you should see windows similar to the screenshots below which allow you to navigate through your DSS project recipes and select a Python script.
When you’re selecting a file, be sure to leave the “Generate Runtime Configuration(s)” checkbox selected and also select the “Install” button as shown in the above screenshot which will install the necessary Dataiku API PIP packages into your local Virtual Environment.
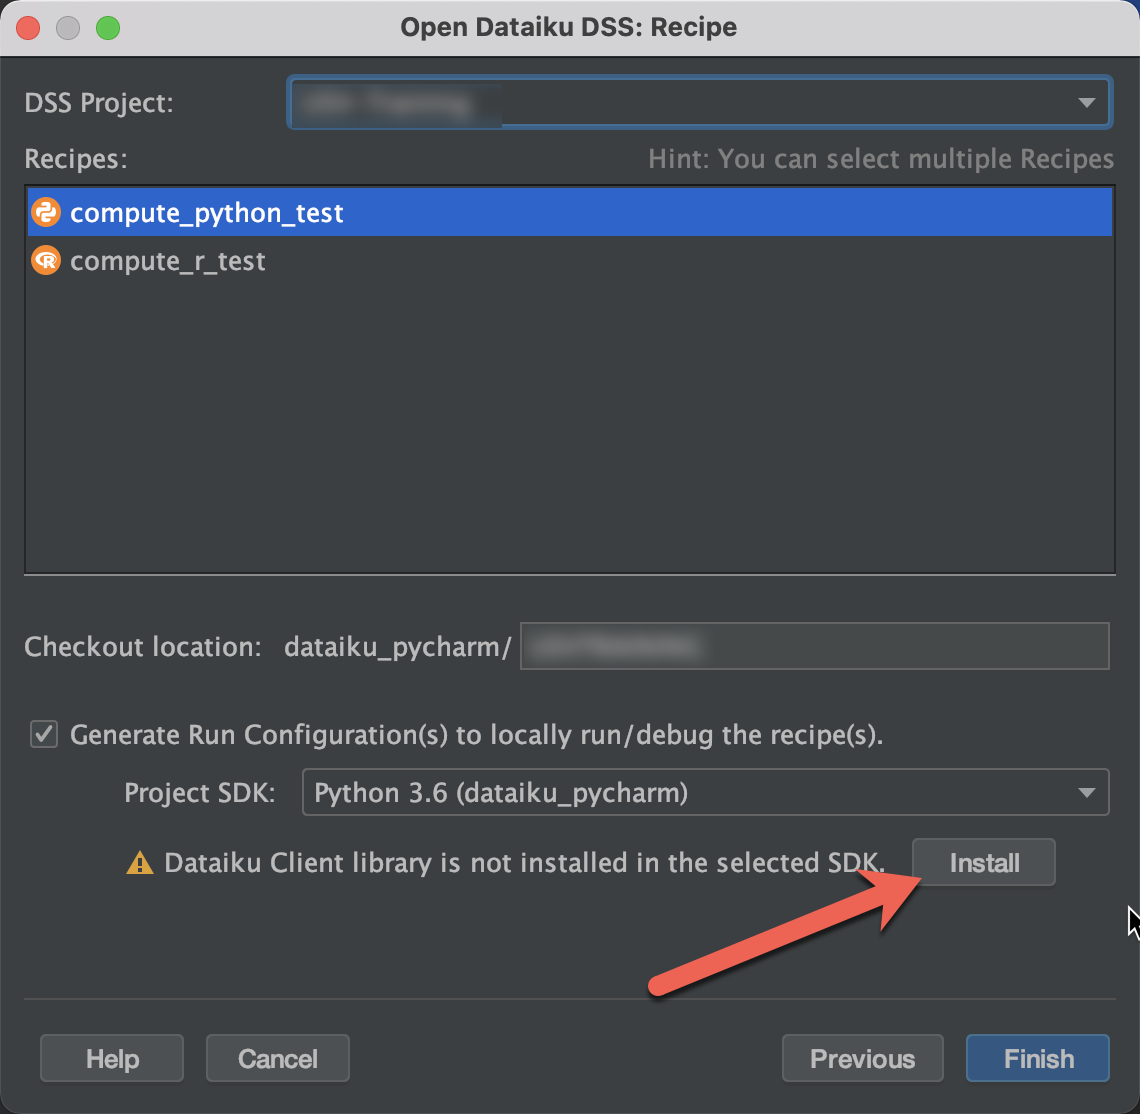
Install the Dataiku Client library. With that complete, click “Finish” and your remote Python file should be opened in PyCharm!
Debugging in PyCharm
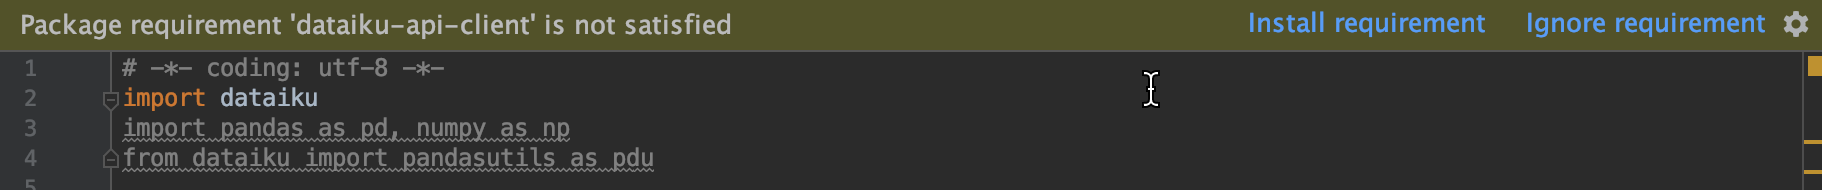
Now that you have your Virtual Environment set up locally and the remote file open, you’ll notice that PyCharm is prompting to install the missing requirement that we’ve defined in the requirements.txt file. ahead and click “Install requirement” to add these packages to your local environment.
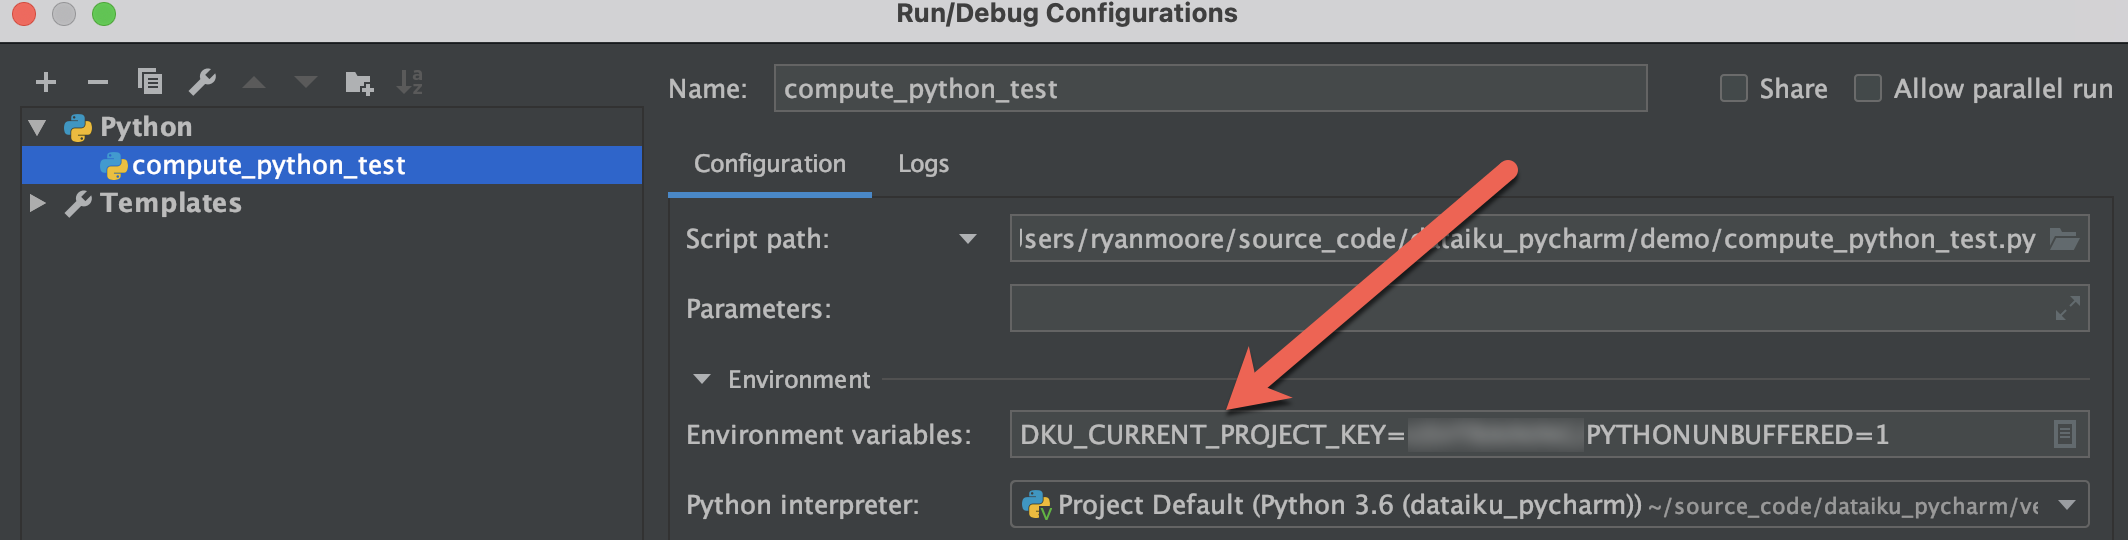
There is an important piece of the puzzle in the PyCharm integration to note. If you navigate to the Run=>Edit Configurations menu, you’ll see the debugging configuration that has been generated by the Dataiku plugin. In this configuration, the Environment variables has been populated with the DKU_CURRENT_PROJECT_KEY key set to the name of your selected Dataiku project. This is a very nice feature, making things a bit easier than the Visual Studio Code integration — but be aware that this debug configuration is specific to this DSS project.
Start Debugging
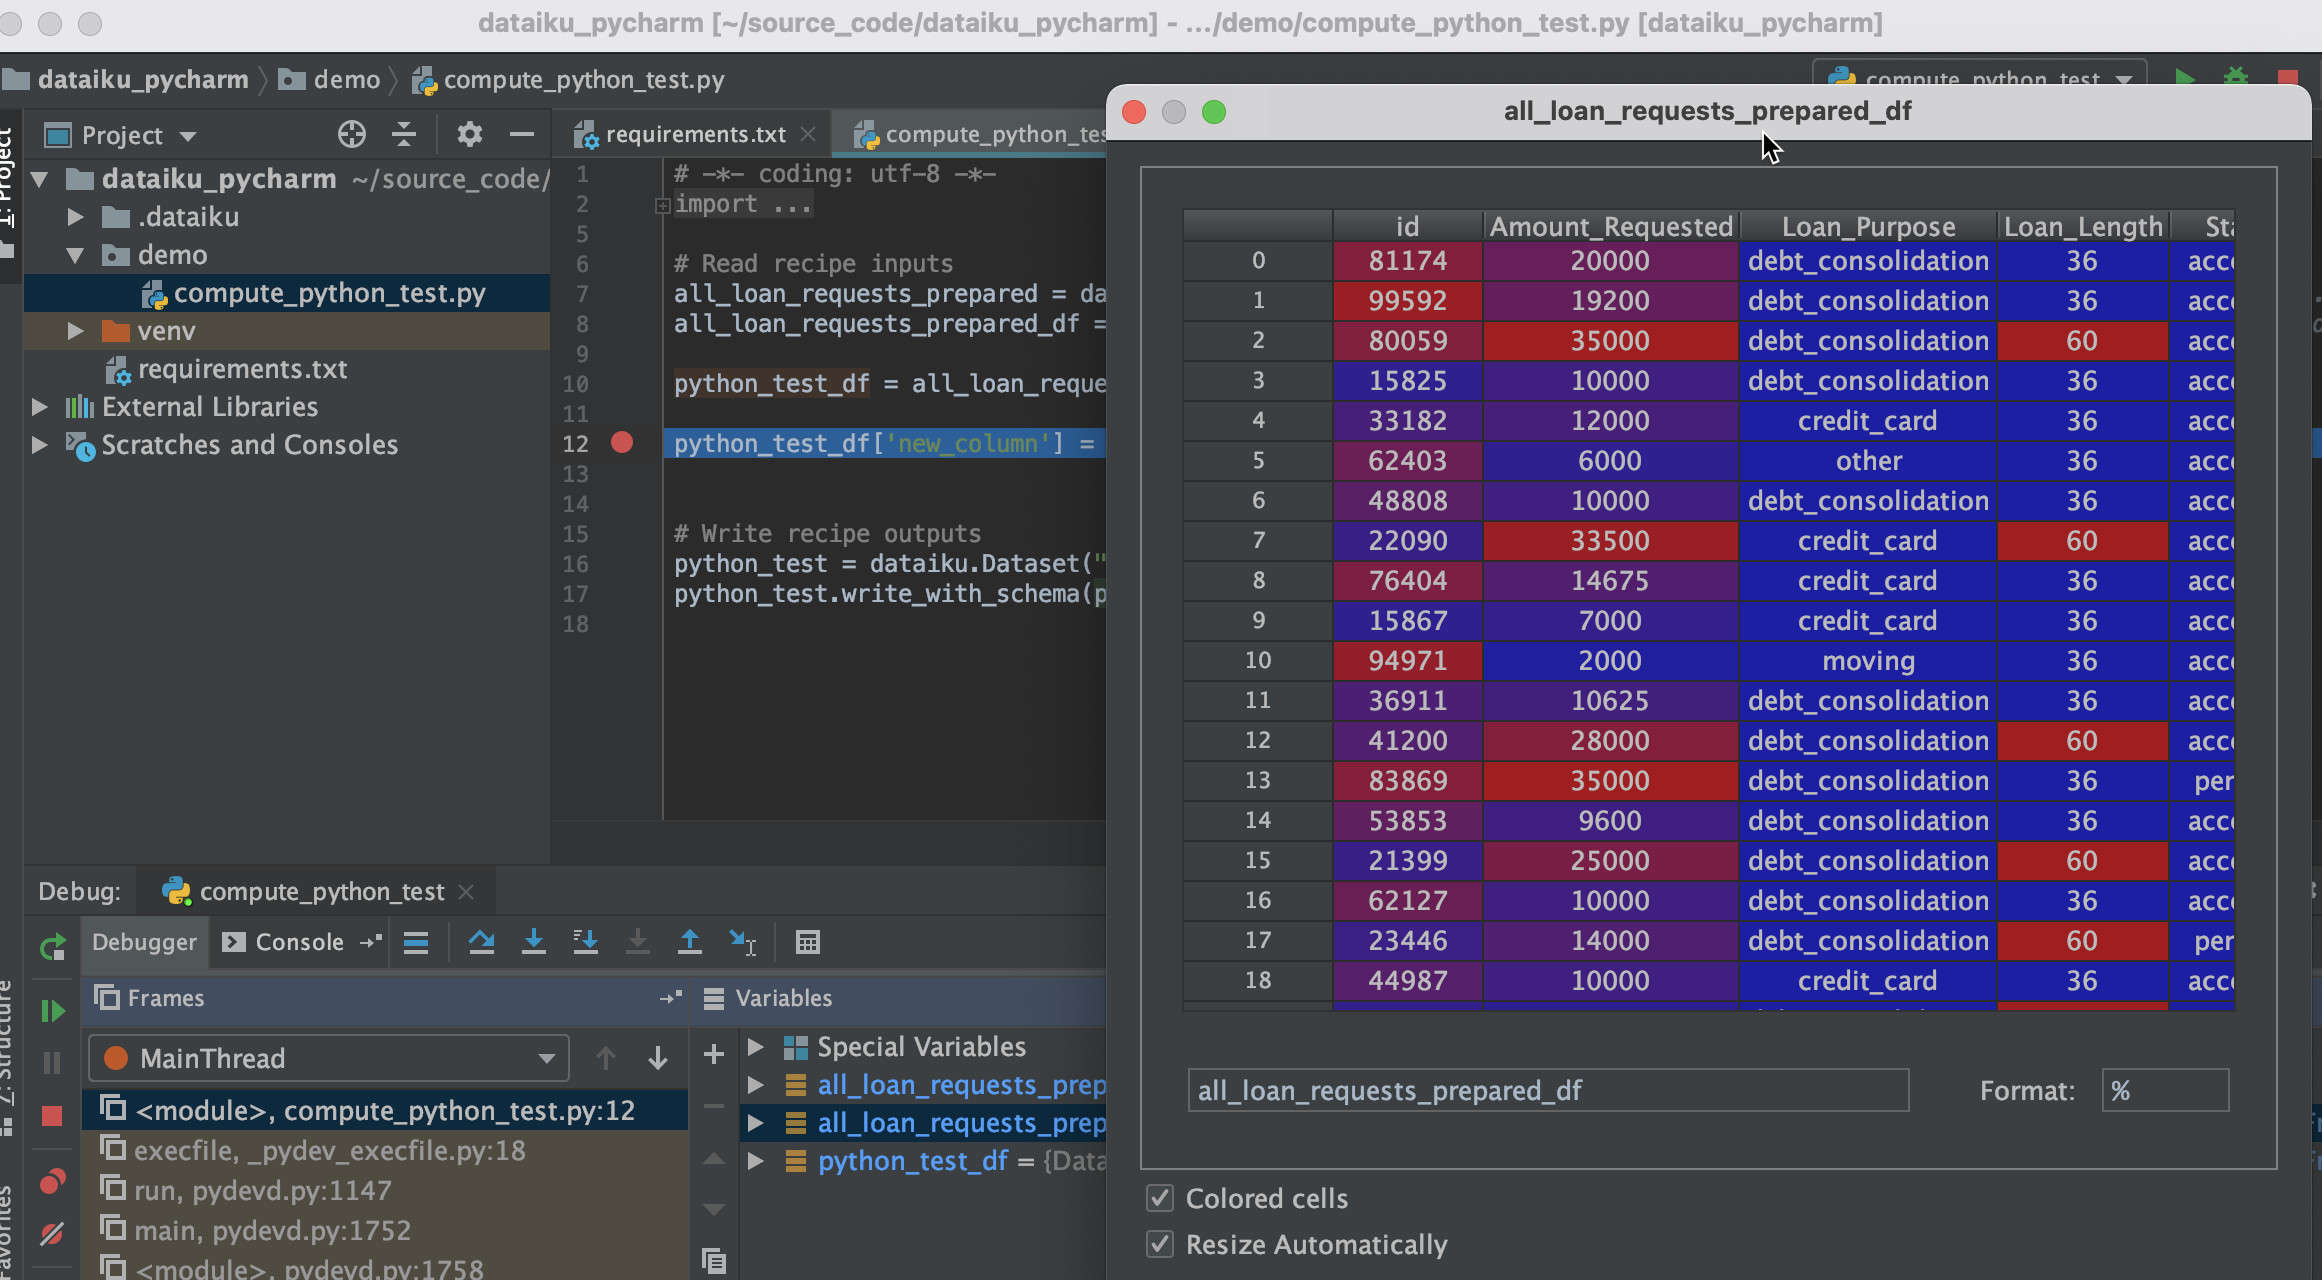
With the Python file open, add a breakpoint somewhere in your code and click the Run => Start Debugging menu item. This will start a debugging session which have full access to your DSS datasets and, if configured correctly, will run in a fully interactive debugging session allowing you to pull data from your DSS instance!
File Modifications
Of course debugging is one of the exciting features available with this integration, but we can also make local edits to the Python file and seamlessly save them back to our Dataiku instance.
To configure this integration, let’s refer back to the DSS Settings panel in PyCharm. In this panel, you’ll see a “Automatic synchronization” option which will determine whether the changes you make to files in PyCharm will be sent immediately to the DSS server or will require manual synchronization. If you prefer to send your file changes to the Design node manually, uncheck the “Automatic synchronization” box.

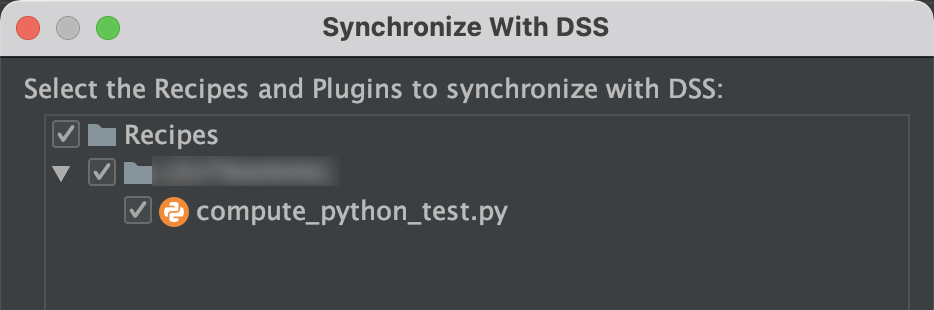
Once you’ve verified the synchronization setting, you should be able to modify your local version of the remote Python file. If you’ve chosen to synchronize manually, you can send your modifications to the server by selecting the File=>Synchronize with DSS menu option.
Learn More
We’ve covered the configuration and setup of PyCharm and a Dataiku DSS Design node for execution of a debugging session and Python code editing — extending the powerful capabilities of DSS to the desktop. Watch this video to learn more about how to extend Python development in Dataiku to another powerful development IDE - Visual Studio Code.