

.jpg?width=300&name=pexels-antonio-batini%C4%87-4164418%20(1).jpg)
Essential Collaboration for Technical Users
In the Data Science universe there is a growing need for powerful, collaborative team tools. Dataiku has emerged as a market leader in Data Science orchestration and is the leader in including technical and non-technical roles in collaborative projects. For technical users, Dataiku provides the power of Jupyter notebooks out of the box for Python code development — but for those requiring more flexibility, it’s also possible to integrate directly with the Visual Studio Code IDE and debug on your desktop.
Let's walk through the configuration and setup of VS Code and a Dataiku DSS Design node as well as code modification and the execution of a debugging session.
DSS Project
The Dataiku project demonstrated here has a single Python recipe that we’d like to connect to with Visual Studio Code and debug interactively. With this integration, we can also edit DSS Plugins, SQL Recipes and R Recipes with VS Code.

Install the Extension
The first step required to integrate Dataiku and Visual Studio Code is to install the Dataiku Extension in from the marketplace. Simply search for “Dataiku” and then click “Install” on the Dataiku DSS extension result.

Once you have the extension installed, you’ll want to configure it to integrate with your Dataiku Design Node instance.
Note: The integration with VS Code will not be possible if you’re using the Free (Community) edition of Dataiku, which does not allow for API integration.
Open up the Command Palette with the Ctrl-Shift-P shortcut (Windows) or Cmd-Shift-P shortcut (Mac). With this open, type “dataiku” to filter to the available Dataiku commands.
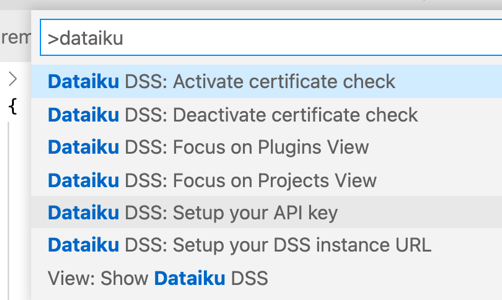
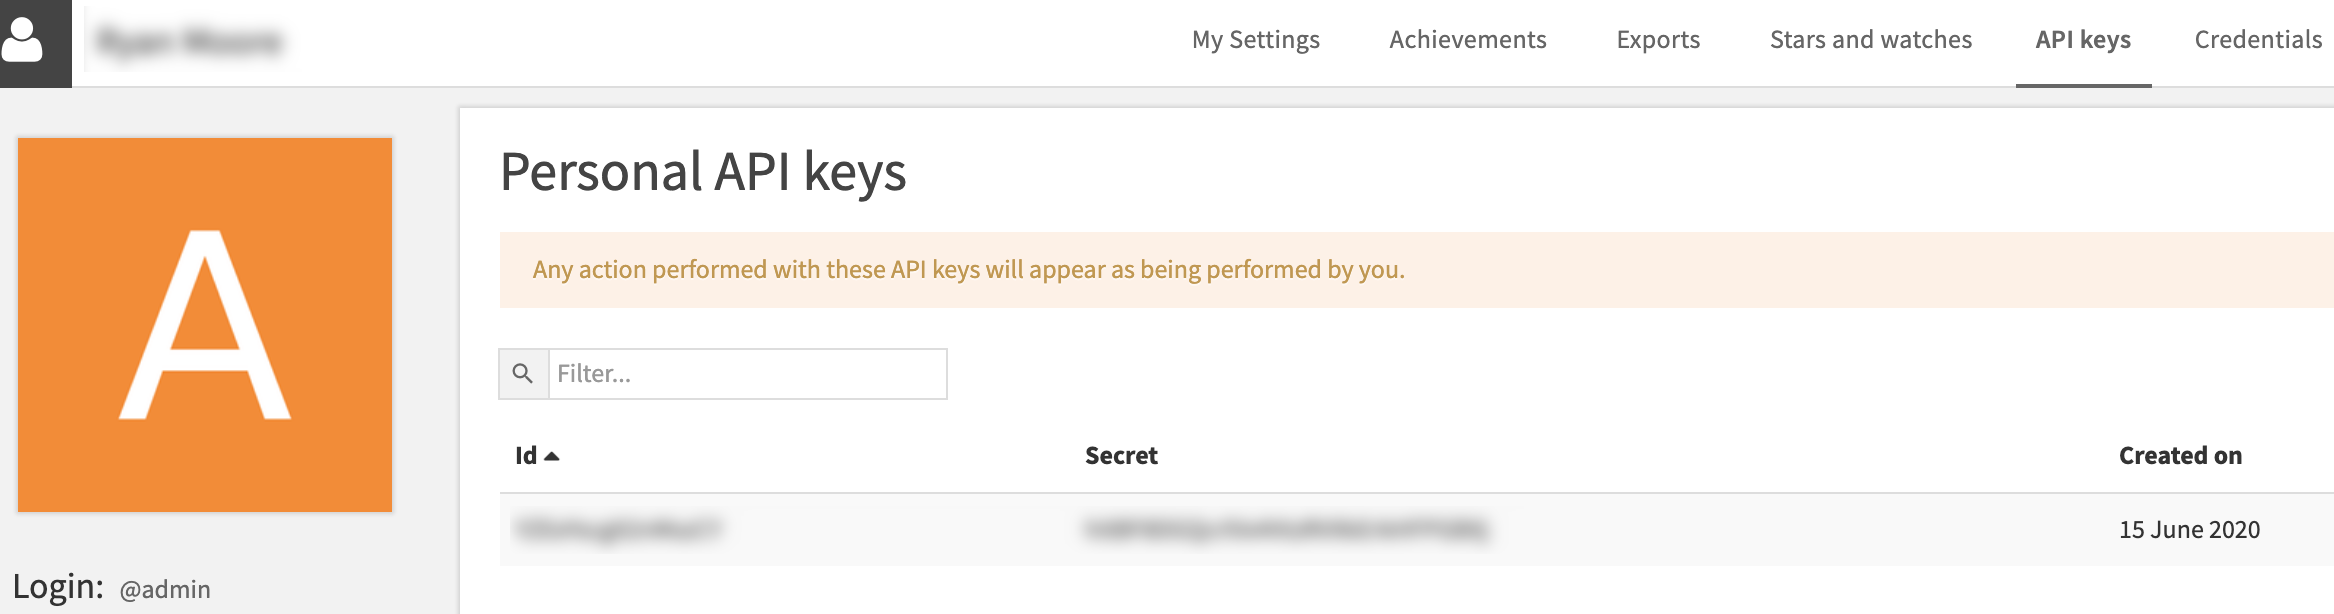
The two commands you’ll want to make use of are “Setup your API key” and “Setup your DSS instance URL”. The instance URL is simply the http(s) url to the Dataiku Design node you’d like to connect, and for those unfamiliar, the API key can be found under the “API keys” tab in your Dataiku user profile.
It’s All About the Environment
With the Dataiku VS Code extension, we will be able to navigate and pull Python code from your DSS instance to your local development environment, but in order to get your local system ready for debugging, it’s also necessary to re-create the Code Environment(s) you use in your Dataiku instance on your local system.
Note: For this step, we’ll assume that you have the version(s) of Python installed on your local system that you’re using on the DSS instance, along with Pip and VirtualEnv.
In order to do this, create a folder for each Code Environment that you’d like to debug. These folders can be shared across projects, but should be unique for each DSS Code Environment you have created. For this example, we've created a directory on my system called “dss_code_env1”.
With this new directory created, open it in Visual Studio Code using the File=>Open menu.
Initialize the Python Virtual Environment
Next, we want to initialize a Python Virtual Environment in this folder which will be a clone of our DSS Code Environment. To do this, let’s start by opening a terminal window inside of VS Code by using the Terminal=>New Terminal menu.

You’ll notice that this terminal prompt opens up in the same directory as the VS Code folder opened above. In this prompt, let’s create a new Python virtual environment with one of the the following commands:
windows: python -m venv venv
mac: virtualenv venv
Once you’ve executed this command, you’ll see a new folder in your VS Code project named “venv” which will contain a new Python Virtual Environment.
Activate the Environment
In order to tell Visual Studio to make use of this new environment, we need to activate the environment in VS Code with the “Python: Select Interpreter” option from the command palette.
Open up this command in the palette and select “enter interpreter path” and browse your local system to the “venv” folder in the directory you’ve created for this example. Inside of the “venv” folder, you’ll find a “bin” directory. From within this directory, select the python version executable that is equivalent to the DSS environment you’re replicating (python36 for a Python 3.6 environment for example).

Once you’ve selected the Python executable, you should see the Python interpreter listed in the lower-left hand corner of your VS Code IDE.

Create a PIP requirements file
Now that we’ve created and activated our Python environment, the next step is to create a requirements file which will define the PIP packages that are required to debug our files.
In your project, create a new text file with the File=>New File menu. In this file, we’ll be putting a couple essential packages needed for this integration, along with all of the PIP packages used in the DSS code environment that is used by your remote script.
Listed below are the packages that are essential to run any local environment. Again, you’ll also want to add any additional packages used by your Python recipe.
dataiku-api-client
pandas
numpy==1.19.3 # for windows, MUST be 1.19.3 until bug fix in 1.19
[dataiku-url]/public/packages/dataiku-internal-client.tar.gz
Note: in the last line listed above, be sure to replace [dataiku-url] with the URL of your Dataiku DSS Design node instance.
Once you’ve added all of your PIP packages, save this file as “requirements.txt” in the root of your project folder.
Install the packages
The final step in our Python environment setup will be to run the pip command necessary to install the packages into our environment. To do this, let’s jump back into the terminal window and run the following command:
pip install -r requirements.txt
Note: Depending on your Python environment / version, you may need to replace “pip” with the correct command for your environment (pip3.6 install -r requirements.txt for example)
This should take a few minutes to complete and if all goes well, won’t see any error messages in the terminal and your environment setup is complete!
Debug Configuration
Now that we have our Python environment created, the next step will be to create a VS Code debug configuration for our project. This step is necessary because Dataiku needs to know which project we’re working on when we execute API commands — so we communicate this through VS Code environment variables.
In order to set environment variables in a VS Code debugging session, we first have to create a Debug Configuration for our project session. To do this in VS Code, click the Run=>Add Configuration => Python => Python file menu option as shown below.

After this selection, you’ll see a new file launch.json appear in the editor. This file defines the details of a debugging session in VS Code. We are going to add a line to this default file to define the project name — or more accurately the project id from Dataiku.
Inside of this file, you’ll see JSON which defines the new configuration. We want to add a variable called env inside of the 1st configurations array entry as shown below:
"configurations": [{ "name": "Python: Current File",
"type": "python",
"request": "launch",
"program": "${file}",
"console": "integratedTerminal",
"env": { "DKU_CURRENT_PROJECT_KEY": "[your project id]" }
}]
After setting up our code environment and debugging session, finally, we’re ready to debug!
Start Debugging
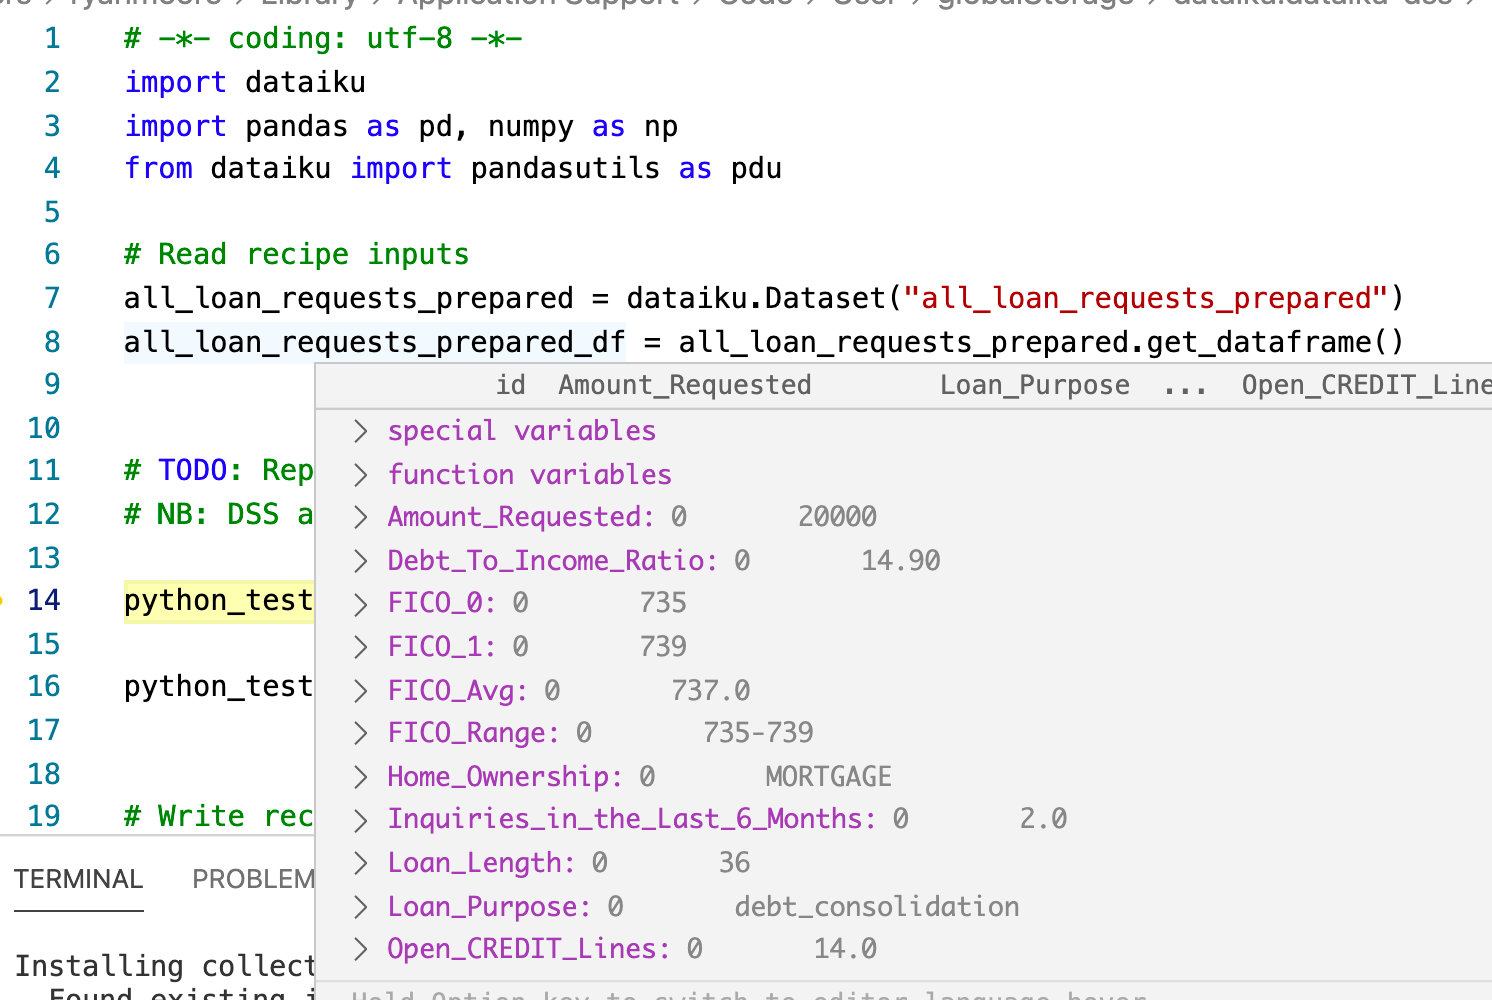
Next, open the Python recipe or plugin we want to debug. Open up the Dataiku extension by clicking the familiar bird from the left icon menu and navigate through the projects or plugins to select the file you’d like to debug (make sure it’s from from the same project specified in your configuration above).
With the Python file open, add a breakpoint somewhere in your code and click the Run => Start Debugging menu item. This will start a debugging session which have full access to your DSS datasets and, if configured correctly, will run in a fully interactive debugging session.
File Modifications
Of course debugging is one of the exciting features available with this integration, but we can also make local edits to the Python file and seamlessly save them back to our Dataiku instance. With the project configured correctly, you should be able to edit any recipe and immediately after saving locally, you will see a “saved” notification as shown in the screenshot below.
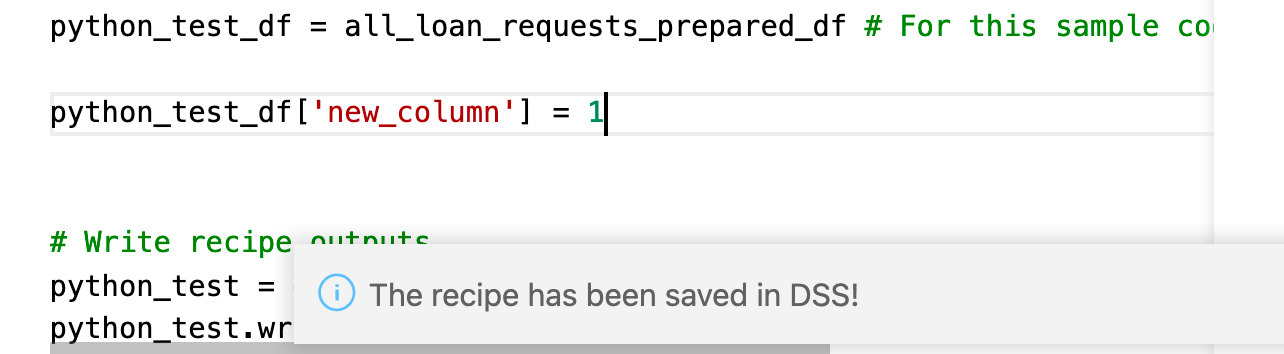
This change will immediately be available in the Python recipe in your DSS Instance.

Learn More
We’ve covered the configuration and setup of VS Code and a Dataiku DSS Design node for execution of a debugging session and Python code editing — extending the powerful capabilities of DSS to the desktop. To learn more, check out our article demonstrating the connection between Dataiku and PyCharm for similar editing and debugging.